- Carbon Black Community
- :
- Carbon Black Cloud Release Notes
- :
- Console Release Notes
- :
- Carbon Black Cloud Console Release Notes
Carbon Black Cloud Console Release Notes
- Article History
- Subscribe to RSS Feed
- Mark as New
- Mark as Read
- Bookmark
- Subscribe
- Printer Friendly Page
- Report Inappropriate Content
Carbon Black Cloud Console Release Notes
Attention: As of 28 February 2022, VMware Carbon Black Cloud Console Release Notes are published on VMware Docs. This UEX site will remain but no longer be updated.
| January 2022 | December 2021 | November 2021 | October 2021 | September 2021 |
| August 2021 | July 2021 | June 2021 | May 2021 | April 2021 |
| March 2021 | February 2021 | January 2021 | 2020 | 2019 |
Dashboard Improvements
The Dashboard now supports modeless editing. There is no longer a need to click Edit before moving and resizing widgets; it can be done without entering an edit mode.
API decommissioning - v3 Alerts, Events and Process APIs
After 31 January 2022, the v3 Alerts, Events and Process APIs will be decommissioned. After this date, they will return an HTTP Response of "410 GONE" and will no longer return previously available data.
For more information, see this October 2021 announcement on the Carbon Black User Exchange: https://community.carbonblack.com/t5/Developer-Relations/Upcoming-API-shutdowns-Carbon-Black-Cloud-v....
Efficacy Improvements
Endpoint Standard customers will see an increase in default prevention value. TAU provides improved detections and fixes for AMSI Threat Intelligence, Privilege Escalation, CarbonBlack Threat Intelligence, and Credential Theft.
- AMSI Detection - Inhibit System Recovery behaviors – Filebacked
- AMSI Detection - Inhibit System Recovery behaviors – Fileless
- Detect Suspect SAM Credential Access – Filebacked
- Detect Suspect SAM Credential Access – Fileless
- Detect Suspect Browser Credential Access
- Detect bitsadmin file transfer
- Detect bitsadmin execution
- Detect Suspect Startup Modifications
- Detect parent process identifier (PPID) spoofing
- Detect suspect registry changes
New Policy and Scope Experience
Policy Rule Selector
To address the growing number of policy rules, we are introducing an enhanced rule selection experience. With the new design, you can easily browse through all available rules using filters, and organize and manage the selected rules to better understand policy impact. Check it out in Enforce -> K8s policies.
Scope Page
When managing the scope, we want to understand the workload scope type, how many namespaces are included in the scope and which workloads, and the policy assigned to the scope. With the newly designed page, we addressed it all! With a new modern look, you can easily identify the scope by type, the assigned policy, and even the clusters, namespaces, and workloads assigned to it. Check it out at Inventory-> Kubernetes-> Scope.
Data Forwarder adds Watchlist Hit Forwarding
The Carbon Black Cloud Data Forwarder now supports forwarding Watchlist Hits for all Enterprise EDR customers. This release provides two significant enhancements to make your automated threat hunting more effective:
- Because certain threat intel feeds do not allow Alerting, all watchlists (whether subscribed from Carbon Black threat intel feeds, or custom watchlists you build yourselves) will have their hits forwarded. This lets you pull augmented data into third-party SIEMs and integrations.
- Additional metadata is included in forwarded Watchlist Hits that is not available in forwarded Watchlist Alerts, including command lines, hashes, digital signature attributes, reputation and username. This is for both for the actor and the parent process, and all tags added to the Watchlist Reports
Configuration for a Watchlist Hit forwarder in the Data Forwarders page is as simple as selecting Watchlist hit under the Type selection. After it is enabled, this Forwarder will forward every hit from every enabled Watchlist in your Carbon Black Cloud organization:
In addition to the data currently forwarded in Watchlist Alerts today, the forwarded Watchlist Hits will include parent_cmdline, parent_guid, parent_hash, parent_path, parent_pid, parent_publisher.name, parent_publisher.state, parent_reputation, parent_username, process_cmdline, process_hash, process_pid, process_publisher.name, process_publisher.state, process_reputation, process_username and report_tags.
The forwarded Watchlist Hits will not include the following fields that are included in forwarded Watchlist Hits today (which are generally only available in an Alert context): alert_url, category, device_os_version, device_username, first_event_time, last_event_time, last_update_time, legacy_alert_id, notes_present, policy_id, policy_name, reason_code, run state, tags, target_value, threat_cause_actor_name, threat_cause_actor_process_pid, threat_cause_actor_sha256, threat_cause_cause_event_id, threat_cause_reputation, threat_cause_threat_category, threat_cause_vector, threat_id, threat_indicators, workflow.
The December 6 VMware Carbon Black Cloud console release includes various bug fixes. See Fixed Issues.
VMware Carbon Black Cloud Managed Detection and Response (MDR) is now available as an add-on for Endpoint Standard and Workload Advanced on VMware Carbon Black Cloud.
MDR is available for upgrade for VMware Carbon Black Cloud Managed Detection (MD) customers.
MDR provides critical insight into attacks by using automated machine learning and algorithms to validate and prioritize alerts and uncover new threats. Our team of security experts monitor alerts from Endpoint Standard or Workload Advanced in the VMware Carbon Black Cloud. They provide rapid response via email notifications of threats and provide specific policy changes to address the threat in the VMware Carbon Black Cloud. Analysts are available to provide incident remediation guidance as well as threat containment during an incident, allowing your security team to accelerate investigations and remediate threats quickly.
| Feature | Description | Managed Detection | Managed Detection and Response |
| Monitoring & Alert Triage | 24x7 monitoring of alerts within SLO*. | X | X |
| Incident Investigation and Response Recommendations | Detailed investigation summaries and response. | X | X |
| Monthly Reporting | Monthly reporting to outline security policy and posture. | X | X |
| Outbreak Advisories | Advisories on emerging threats with IOCs and policy recommendations. | X | X |
| Threat Containment | Analysts take actions on your behalf to stop incidents from escalating. | X | |
| Two-way Communication | Communicate directly with our analyst team over email for guidance during a security incident. | X |
To configure MDR, see https://community.carbonblack.com/t5/Managed-Detection-Discussions/Cb-Managed-Detection-Welcome-Pack....
* VMware Carbon Black Cloud Managed Detection and Response monitors alerts from Endpoint Standard or Workload Advanced that have a priority of 5 or greater. Alerts that have a priority 8 or above will be thoroughly investigated or emails responded to within 2 hours of their arrival to the team. Alerts that are within the 5 to 7 priority range will be triaged or responded to at best effort.
A new article on the Dashboard Getting Started widget helps guide you through testing the connection between the Carbon Black Cloud content delivery network and your endpoints.
By using this widget, you can proactively prevent endpoints from silently failing to download content, which could cause rules, EDR data, etc., to not be delivered to the sensor.
Links to the VMware Carbon Black Sensor Installation Guide and UEX Knowledge Base articles provide context and remediation steps for users who are experiencing connection issues.
Data Forwarder Advanced Filtering
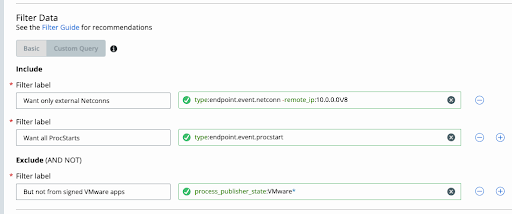
The Data Forwarder has introduced a granular filtering capability for endpoint events. This lets you specify exactly which endpoint events to forward from Carbon Black Cloud to non-Carbon Black Cloud integrations such as SIEM and SOAR solutions.
This enhancement to the Data Forwarder includes a significantly improved Data Forwarder user interface, which includes the ability to upgrade existing endpoint event Forwarders to take advantage of the added filtering options. It also ships a new API that provides individualized Forwarder and Filter control and a validation feature to test proposed filters before implementing them in your production pipeline.
While this new filtering interface accepts similar kinds of input as you can use on Alerts and Investigate pages, you cannot cut-and-paste queries from Alerts or Investigate pages and apply them directly to your Data Forwarder event filters - the schemas are incompatible and the syntax can sometimes vary. For this reason, the Data Forwarder provides detailed validation to ensure that only valid Data Forwarder syntax and field definitions are assigned to your endpoint event Data Forwarders.
Special note for customers with existing Forwarders of type endpoint.event: The first time you save an edit of the existing filters using the console, we will upgrade that filter in the background to be saved in the new v2 filter format. To continue to directly use the Data Forwarder Configuration API after that time, you must update your code to use the v2 API. The v1 API will refuse to assign filters to a Data Forwarder if that Forwarder instance has filters assigned in the new v2-compatible format. This prevents potentially-conflicting filter configurations from running at the same time on a single Data Forwarder instance, where it would be impractical to represent both filtering configurations side-by-side in the console or in either version of the API.
This release contains a bug fix.
This release adds support for RHEL/Centos 8.1, 8.2, and 8.3 for Vulnerability Management.
Improved alert dismissal context
When dismissing an alert for future, which dismisses all future alerts that share the same threat ID, you can now click on the threat ID to search for all matching alerts. You can dismiss all current open alerts that share the same threat ID, which reduces the need for a separate step to clean up those alerts. Additional context related to what a threat ID consists of has been added to the dismissal pane help text.
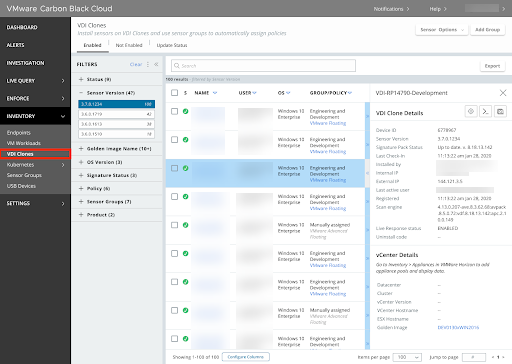
VDI enhancements in the Carbon Black Cloud console
Customers can now more easily view their VDI Clones on a dedicated page in the Inventory section of the Carbon Black Cloud console. The new VDI Clones page helps to give added clarity to customers managing large ephemeral clone pools that typically have different needs and lifespans than traditional endpoints. Horizon and Citrix VDI Clones running Windows sensor 3.7 or later (3.7.0.1533 is recommended) and Horizon Linux VDI Clones running sensor 2.12 or later will now appear on the VDI Clones page instead of the Endpoints page.
Note: Citrix VDI is not supported on the Linux platform at this time.
Golden Images will remain on the Endpoints or Workloads page depending on the products enabled in your organization.
VDI clones running older sensor versions will remain on the Endpoints page until they are upgraded to Windows sensor 3.7 or later or Linux sensor 2.12 or later.
Customers can also more easily see the golden image-to-clone relationship in the console and view all clones for a specific golden image. When the customer expands the golden image endpoint details, a link displays that includes the number of clones that are associated with the golden image.
Note: The new VDI enhancements are being enabled in phases. If you are interested in having this feature enabled in your organization, reach out to Support or your account team.
Learn more about the new VDI Clones experience in the Carbon Black Cloud User Guide.
Additional resources:
- Installing Sensors on Endpoints in a VDI Environment
- Windows Sensor Release Notes
- Linux Sensor Release Notes
The new VMware Carbon Black Container Network Visibility Map provides visibility and context into workloads. This provides a better understanding of the connectivity of the different workloads and how they consume services with Egress connections from external sources outside of the cluster. To simplify this process, the Network Visibility Map lets you view these workload connections in a single map of the application architecture.
Supported platforms in this release:
- Kubernetes platforms - Tanzu kubernetes grid, EKS, GKE, AKS
- Operating systems - Ubuntu, Amazon Linux
- Linux kernel - 4.8 +
- CNI - Calico, Antrea, Azure CNI, GKE CNI, Amazon VPC CNI
Not supported in this release:
- Kubernetes platforms - Tanzu kubernetes grid on vSphere, GKE v2 dataplane
This is primarily a maintenance release. Please see the list of fixed issues for details. There are no functional changes.
Results Reporting on Investigate page
The Investigate page has refocused the summary/count of results to focus on the data that you have received and how much data is left to explore. The console reports the number of results that are returned until the request results are 10,000. Above that limit, the console reports the full 10,000 returned results and an approximation of how much data contributed to the result.
Three changes on the Investigate page summarizes the results of your search request:
- Focuses on the count of how many results can be paged through
- Reports a percentage of your data that contributed to this search result, if the limit of 10,000 results was reached
- Presents a tooltip to offer ideas of what to do next
Default time range setting change for V6 Alerts API
To improve the resilience and stability of VMware Carbon Black Cloud, we are setting the default create_time range setting of the V6 Alerts API to one month. Effective Wednesday, 20 October 2021, if no time range is specified in the search request, the API will search through the last month’s data instead of searching through all alerts. Affected routes include _search, _facet, and workflow/_criteria. This change results in faster API response times on average.
You can specify longer time ranges or search through your entire history of alerts by using the "range" field when filtering by create_time, last_update_time, first_event_time, or last_event_time criteria. Specifying "all" as your desired range will search all available alerts. For questions about this change, please reach out to Developer Relations.
This change does not impact functionality on the Alerts page in the console.
Threat Reports Bulletin
The Threat Reports widget, which hosts TAU-TINs, has been updated to include a new report type called a Bulletin. A Bulletin provides an initial summary of a newly breaking, emerging threat. This provides faster notification of threats as the VMware Threat Analysis Unit (TAU) is analyzing them. Any Bulletin may be upgraded to a TIN as TAU learns more about the threat.
Definitions:
Bulletin: Preliminary TAU report on newly breaking, emerging threat (no search query).
TAU-TIN: More comprehensive TAU report on emerging threat (with search query).
Console Improvements and Fixes for Alerts
- Fixed Alerts query to not delete entered query.
- Updated Alerts dismissal logic so that only what is selected is dismissed.
- Added Dismiss all current alerts checkbox.
- Converted the Alerts Dismiss for future options to radio buttons.
- Corrected Alert Details dropdown - dismissed alerts referenced all assets, even when alert was only for one device.
- Added auditing for all Create/Update/Delete-style operations in all /appservices/ APIs.
- The alerts page search query handling logic now matches other search pages. Any query that is entered but not submitted in the Alerts search bar will be added to the search if the facets or time window are updated.
- When group alerts were on, the dismissal modal dismissed all the alerts associated with the threat id. This is corrected.
FedRAMP Audit Logs
In accordance with FedRAMP requirements related to transmitting, processing, or storing of federal data, controls are implemented to make sure that activity within the environment can be monitored centrally, correlated with other activity, and analyzed to identify potential risks to the confidentiality, integrity, or availability of the system.
Additional Audit Logs ensure that all read operations on any significant tenant data and configuration are captured.
Example of additional audit log data:
We have updated the Endpoints page to be similar to the Workloads page. The changes involve a similar location of tabs and allowing Groups to be formed in a consistent manner. There are no functional changes.
Recommendations
The Recommendations feature assists in tuning your console and optimizing your environment. Carbon Black Cloud presents recommendations of policy rules that are relevant and impactful to your environment. This feature allows you to review policy rules before accepting and implementing them. We currently provide Hash and IT_Tool based recommendations, and will add more recommendation types in future releases.
NOTE: Recommendations is being deployed in a phased rollout. Not all customers will have access to Recommendations at this time.
Efficacy Improvements
Endpoint Standard customers see an increase in default prevention value. TAU provides improved detections and fixes for AMSI Threat Intelligence, Privilege Escalation, and Credential Theft.
- Generic detections and blocking of fileless attacker toolkits executing an initial/staged payload
- Detect GetSystem Name Pipe Privilege Escalation
- Detect GetSystem on-disk Name Pipe Privilege Escalation
- Detect Privilege Escalation via High Integrity Processes (UAC Bypasses)
- Detect Scheduled Task UAC Bypass via windir Environment Variable
- Credential Theft Detection and and blocking of malicious DLLs and executables
Email Notification Update
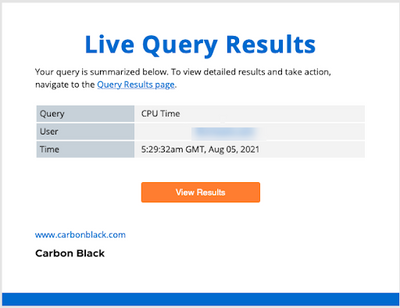
To limit the transmission of sensitive information, the email notification template for query result notifications no longer includes the SQL string that the query uses. The new email notification template still includes the query name, the user that ran the query, the time the query completed, and a link to view query results.
The process event counts on the Process Investigate tab are sometimes inaccurate and do not match the event counts on Process Analysis. To eliminate confusion when performing threat hunting exercises, the Process Investigate tab now shows that the true event count in Process Analysis can be higher. We have appended a + and Help text to the event counts on the Processes Investigate tab.
New filters
You can filter workloads as golden images that have clones, which were created by using the VMware Horizon desktop pool.
You can filter workloads based on their signature pack status (out-of-date, up-to-date, not applicable, and not available).
Kubernetes Workload Details - Page Redesign
With the new page design, you can now easily evaluate workload deployment status, risk severity, hardening and compliance state through a dedicated tabbed view for each use case. The new page is available on Inventory > Kubernetes > K8s workload.
Updated Dynamic Prevention Rules
In the coming weeks, dynamic prevention rules assigned by Carbon Black will be updated for VMware Carbon Black Prevention customers. This update will fix an issue where select dynamic prevention rules were behaving incorrectly. We have fixed this issue and will be rolling it out to all Prevention customers. No action is required and the user experience will remain unchanged.
Vulnerability Management for Endpoints
VMware Carbon Black announces the general availability of Vulnerability Management for Endpoints. This new functionality helps you reduce the attack surface and simplify operations with prioritized vulnerability reporting and continuous visibility across your environment. Building on the earlier release of Vulnerability Management for Workloads, this new capability extends that functionality to your endpoints. This solution brings three key values to your Vulnerability Management workflows:
- Prioritized: Leverage patented vulnerability prioritization data from Kenna Security based on CVE + real-life exploitability. Increase patching efficiency by 4x with best-in-class prioritization that helps you focus on common exploits and high-risk vulnerabilities to reduce attack surface.
- Scanless: Alleviate the performance issues of legacy vulnerability scanners with:
- Real-time vulnerability assessment that requires no additional data collection and analysis to be performed on your devices.
- Leverage the existing capabilities of Carbon Black’s sensor across your environment to gather device and application inventory for vulnerability assessment.
- Built-in: Deliver functionality natively as part of your extensible VMware Carbon Black Endpoint Protection Platform (EPP). There are no additional agents or consoles to deploy, manage, and maintain.
Full details on supported OS and sensor versions are here.
To install and administer Vulnerability Management in VMware Carbon Black Cloud, follow the instructions here.
Note:
- This release also introduces support of Windows 7 and 10 vulnerability data to environments with VMware Carbon Black Cloud Workload Protection.
- Accessing Vulnerabilities depends on your system configuration. If you have the Container Security feature enabled, go to Harden > Vulnerabilities. If you do not have the Container Security feature enabled, click Vulnerabilities in the left navigation pane.
CB Analytics Alert ID Changes
In the V6 Alerts API response, customers viewing CB Analytics alerts after 19 August 2021 might notice that legacy_alert_id now equals id.
The field legacy_alert_id used to represent an 8-character ID and differed from the standard GUID format (ie. 33bca411-77b6-4c6c-a643-ce9e7f82c742) used across all other alert types in the VMware Carbon Black Cloud. To better unify alerts, Carbon Black Cloud has aligned on the GUID format as our standard for all types of alerts in the product.
This change should have no effect on user behavior, nor will it affect your ability to search on past alerts that use the shortened legacy_alert_id format. The field legacy_alert_id will be deprecated in a future API revision.
For more information on this change, see the VMware Carbon Black Developer Relations blogpost.
Console updates
The Vulnerabilities page is updated in the following ways:
- Under Vulnerabilities > VMs, a View by menu now displays with VMs and Vulnerabilities values. The default value is VMs.
- V2 graphs are available by clicking Show graphs.
- Affected Assets view has been updated.
The Investigate page is updated: the event counts (netconn, etc) displayed on the Processes tab and in the right pane represent a lower bound of the true number of events that were generated by the sensor.
Process loaded script name and hash data expanded
On the Triage Graph’s right side node panel, the process loaded script name and hash data was added, and the process information was reorganized. The process loaded script details were added to the Triage Events Table expanded information.
Efficacy improvements
- Added a false positive exception for macOS browsers injecting into other processes in specific situations. This is known to have affected Firefox and Thunderbird.
- Expanded the false positive exception for certain processes writing to raw disk to include some popular programs, including RaspberryPi’s disk imager.
- Eliminated two noisy alerts for Linux related to system utilities invoking other system utilities. The core logic has been refined to ignore some common user and/or automated behaviors.
New recommended query
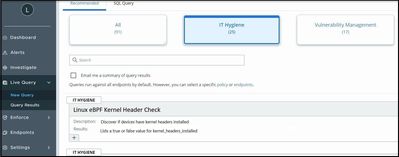
The TAU team has crafted a new recommended query that confirms if devices running Linux Kernel versions 4.4+ meet configuration requirements for Linux Sensor versions 2.10+. The Linux eBPF Kernel Header Check query results shows which machines have kernel headers installed and thereby meet the sensor prerequisites for install noted here.
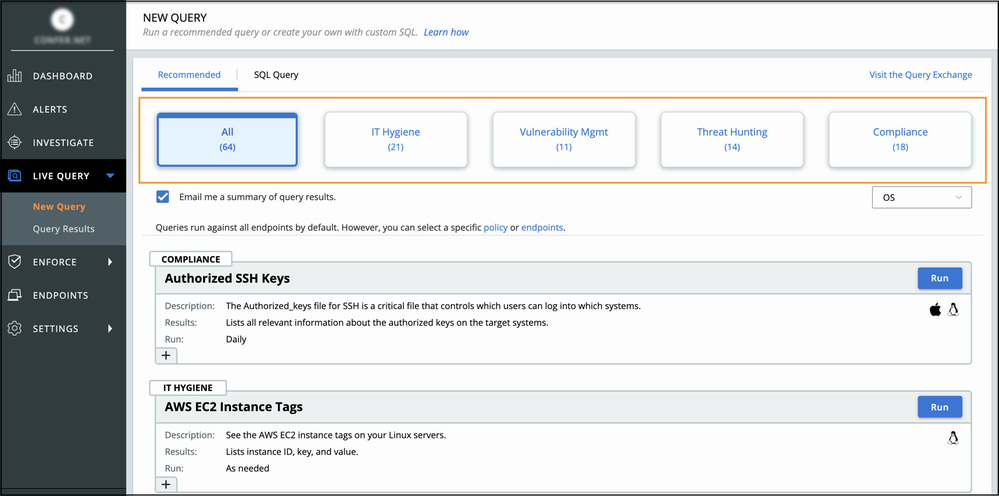
You can find the new query in the VMware Carbon Black Cloud Console by navigating to Live Query > New Query > Recommended > IT Hygiene and scrolling down to the Linux eBPF Kernel Header Check query.
New Kubernetes custom rule experience
Kubernetes policy is a mix of built-in and user-defined policy rules to help detect and enforce security and compliance standards throughout Kubernetes environments. With custom rules, you can utilize the VMware Carbon Black Cloud container policy engine to programmatically enforce security, compliance, or governance rules tailored to your unique use case, like workload labels, naming conventions, and more. With the new Custom Rule experience, you can easily craft a complicated query through a simple wizard using objects imported from the system, JSONPath navigator, and a preview of the findings.
You can find the new query in the VMware Carbon Black Cloud Console by navigating to Enforce > Kubernetes Policy > Rule Table > and click the Add Rule icon. Then select JSONPaths, methods, values.
For Workloads, two improvements are released. See Fixed Issues.
RBAC Improvements for Multi-tenant Customers
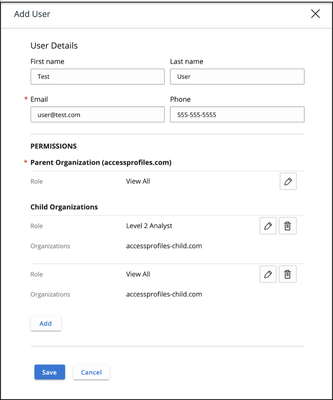
Customers and Partners in a multi-tenant configuration can assign varying levels of access to users for the org in which they were created, and in any of that org’s children.
When switching between orgs, users can only see the orgs to which they have access.
RBAC Improvements for Data Forwarder
We have separated Data Forwarder-related permissions from the Manage/View Org Information and Codes permissions into independently-assigned permissions:
- Manage Data Forwarders lets you create, edit and delete Data Forwarders in their organization through the Event Forwarder Config API and the Settings > Data Forwarders page in the console. This permission is assigned by default to the Super Admin role.
- View Data Forwarders lets you review the details of any Data Forwarders that are configured for your organization through the Event Forwarder Config API and the Settings > Data Forwarders page in the console. This permission is assigned by default to the System Admin and Super Admin roles.
For API consumers who want to create a custom Access Level, you will find the permission continues to be named event-forwarder.settings, and is now grouped under the Data Forwarder category.
Identity and Access Management APIs
Customers and partners can now programmatically create users and manage access with the User Management V6, Grants V2, and Roles V3 APIs.
- User Management v6: You can create, update, and delete users, and retrieve details about the user.
- Grants v2: You can create, update, and delete role assignments for users, or update the access level that is assigned to a custom API key token. By using the API, you can assign multiple roles to a user for a single org, set expiration dates on role assignments, and enable or un-enable role assignments.
- Roles V3: Users can identify which roles they can assign in an org, based on their level of access.
VMware Data Retention
VMware Data Retention is extended data retention for Carbon Black Cloud endpoint products. Today, Carbon Black Cloud offers a 30-day data retention standard in endpoint products. With VMware Data Retention, we offer 60-, 90- and 180-day options for event data.
Workloads
The enhanced search filter on the VM Workloads page allows you to filter on a more granular status of the sensor. Instead of showing only a high level status of Registered or Deregistered, the filter now shows detailed filters such as Active, Inactive, Bypass, Quarantine, Sensor out of Date, and Deregistered.
We have added a field to the VM Workload Enabled data export, which is displayed in Signature Pack Status.
You can now view the vulnerability data for virtual machine (VM) workloads that have a sensor installed, even if the appliance is not configured.
To improve the user experience, we modified the VMware Carbon Black Cloud User Guide table of contents to match the left navigation pane of the VMware Carbon Black Cloud console.
Endpoint Standard
Alert Triage for additional preventions
VMware Carbon Black’s Threat Analysis Unit (TAU) delivers dynamic, high-fidelity preventions to protect against critical threats related to ransomware, credential theft, file-backed and fileless Powershell scripts, and more. These high-confidence preventions are delivered to all Endpoint Standard-enabled sensors version 3.6+ and require no customer action. To date, alert triage has been unsupported for these preventions, as was stated when they occurred:
Alert triage is now supported for these preventions. Clicking the Alert Triage button allows you to view parent, primary, child, and other related processes for an associated prevention.
Note: Customers with a https://defense-prod05.conferdeploy.net/ console login URL will receive this update on Tuesday, May 4th.
Enhanced Enriched Events details API
The /v2/orgs/${orgKey}/enriched_events/detail_jobs API is updated. You can view detailed Enriched Event information for a given alert, including information about related processes, with one simple search query. This reduces investigation time and allows you to access the alert's associated events faster. For more information, visit the Request Details for Enriched Events section on the VMware Carbon Black Developer Network.
April 29, 2021
VMware Carbon Black Cloud Container helps organizations reduce risk, obtain compliance, and achieve secure Kubernetes environments at scale. This solution integrates into existing DevOps processes to reduce operational complexity, and helps security teams enforce compliance, security, and governance from a single dashboard.
This release includes Container Image Scanning and CI/CD integration capabilities to scan containers and Kubernetes configuration files early in the development lifecycle. Therefore, vulnerabilities and misconfigurations can be addressed faster. It enables visibility into all containers that are running in production to enforce security policies, and ensures that all containers running in production have been scanned.
Documentation
- In-product User Guide available from the Help menu
- In-product onboarding available in the Getting Started widget on the Dashboard
- Operating Environment Requirements (OER)
Kubernetes Operator Improvements
Operators are software extensions to Kubernetes that make use of custom resources to configure the Carbon Black Cloud Kubernetes agents. Operators follow Kubernetes principles — in particular the control loop — to install and manage data plane components that the Carbon Black Cloud requires.
The Kubernetes operator in Carbon Black Cloud is a go-based operator, using the latest operator-sdk v1.5.0. The refactoring introduces various improvements and bug fixes.
Note: Existing installations of Carbon Black Cloud Kubernetes cluster agents cannot be upgraded and should be reinstalled. For more information, see the following procedure.
Upgrade an existing Kubernetes Cluster Agent
- Uninstall the existing Kubernetes cluster agent setup.
- Delete the data plane by using the following command:
kubectl delete --wait -n octarine-dataplane octarines.operator.octarinesec.com octarine
kubectl delete -f https://setup.dev.containers.carbonblack.io/operator-v2.0.1
This command removes the Kubernetes agent from the cluster. The cluster's workloads are not available in Carbon Black Cloud and policies are not enforced until the agent is re-installed. - Delete the Kubernetes cluster agent from the Carbon Black Cloud console. For details, see Delete A Kubernetes Cluster.
- Delete the data plane by using the following command:
- Set up a new Kubernetes cluster agent. For details, see Set up a Kubernetes Cluster.
The following table provides a general timeline for when you can expect to see these changes in the VMware Carbon Black Cloud console. Please reference the URL that appears in your browser when you sign into the Carbon Black Cloud console.
| Login URL | ETA |
| https://dashboard.confer.net/ | April 19 |
| https://defense.conferdeploy.net | April 20 |
| https://defense-prodsyd.conferdeploy.net/ | April 19 |
| https://defense-prod05.conferdeploy.net | April 20 |
| https://defense-eu.conferdeploy.net | April 20 |
| https://defense-prodnrt.conferdeploy.net/ | April 20 |
Note: The Carbon Black Cloud user interface is updated on April 26, 2021.
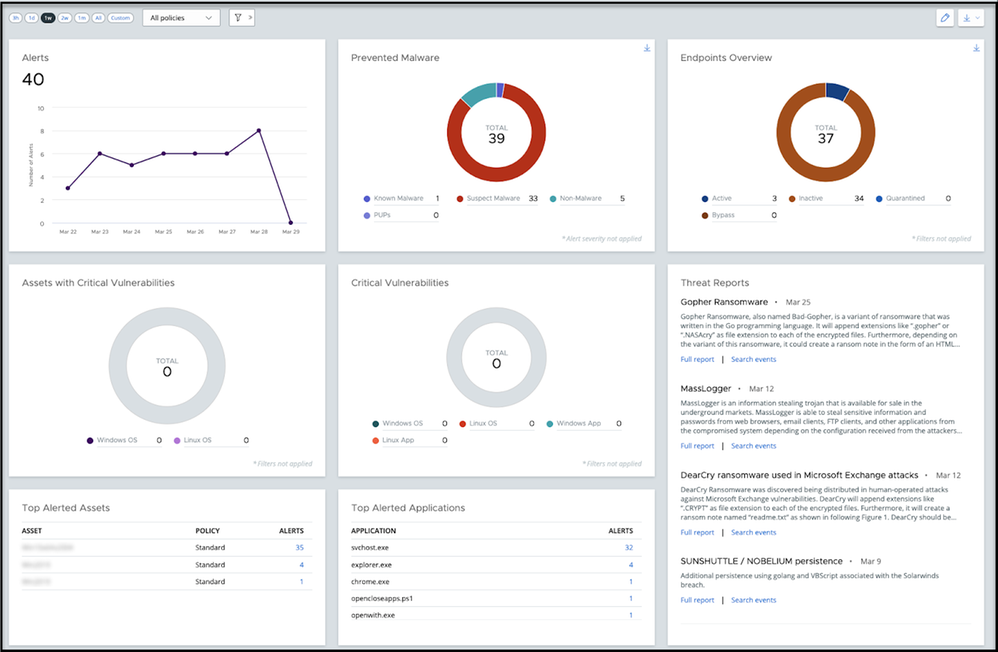
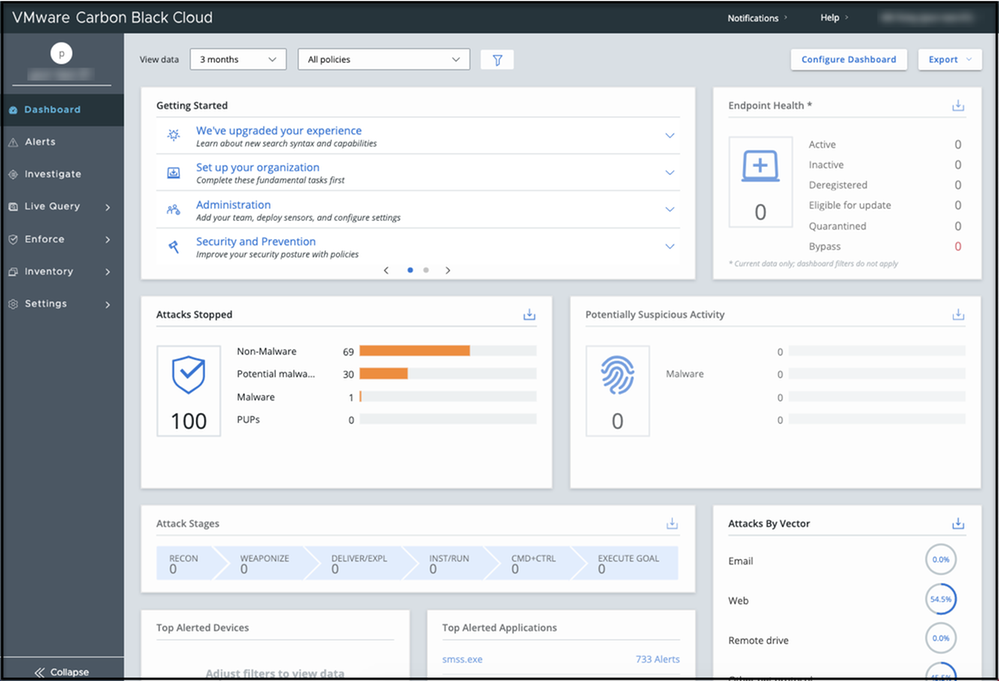
In security, every moment matters. You and your team need to find the information you need quickly and easily, right when you need it. We’ve introduced a new and improved VMware Carbon Black Cloud dashboard to increase your efficiency and simplify your workflows.
This change affects nearly all VMware Carbon Black Cloud customers who have endpoint and/or workload protection, except for customers who only have Audit and Remediation.
A refreshed look and feel makes the dashboard more visually appealing. Information is now easier to view and understand.
New functionality
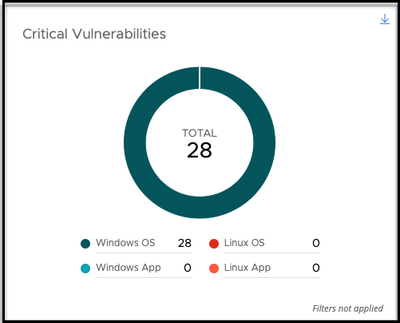
- To help you conduct faster investigations, all widgets are clickable and automatically filter based on your selection. For example, if you click Linux OS vulnerabilities in the Critical Vulnerabilities widget, it takes you to the Vulnerability page and filters the content by Linux OS.
- We have introduced quick and easy PDF reporting. With one click, you can create a PDF of the widgets and their associated graphs to share with your extended team.
New widgets
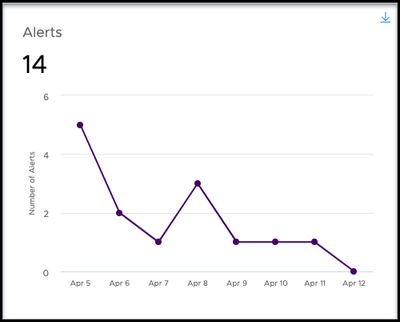
- Alerts: See a trending graph of alerts by 1, 3, or 7 days, so you can easily identify an event and see when alerts have increased or decreased.
- VM Workloads Overview (workload customers): Track the status of virtual machines.
- Critical Vulnerabilities (workload customers): Easily spot a breakdown of the most critical workload vulnerabilities in your organization, filtered by operating system.
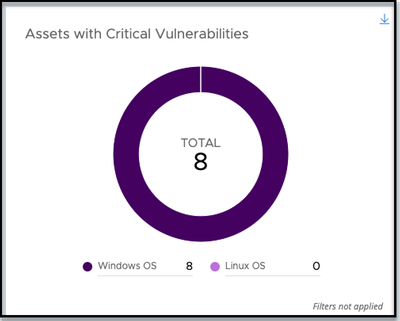
- Assets with Critical Vulnerabilities (workload customers): Easily spot assets that are affected by critical workload vulnerabilities.
Upgrades to existing widgets
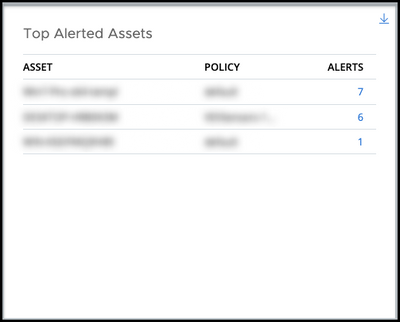
- Top Alerted Devices renamed to Top Alerted Assets (endpoint customers): See the endpoint devices that have the top alerts.
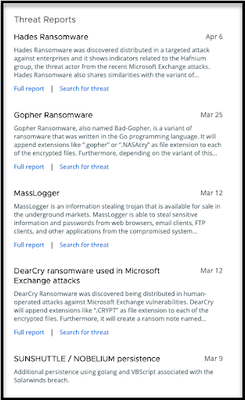
- Threat Reports: See if the latest threats identified by the VMware Carbon Black threat team exist in your environment. One click takes you to the Investigate page with the pre-populated query to search for the attack, thereby enabling faster investigations.
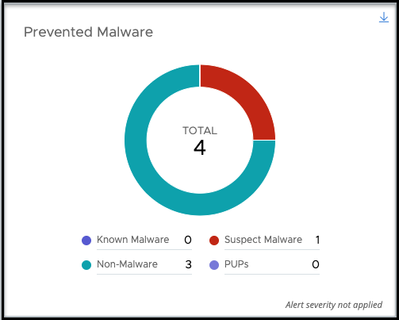
- Prevented Malware replaces Attacks Stopped: See all of the malware stopped in your environment.
Retired widgets
Based on customer feedback, we have retired the Attacks by Vector, Attack Stages, Potentially Suspicious Activity, and VMware AppDefense widgets.
What isn't changing?
Existing functionality including filters, the ability to configure your personal dashboard, widget manipulation, and Export to CSV is retained.
Updated Live Response with granular RBAC
Carbon Black Cloud Live Response has been overhauled to help increase security and reduce integration friction.
With this update, you have four permission levels for improved least-privileged access to Live Response:
- View Live Response - Administrators can interact, but cannot make any changes to the endpoint.
- Use Live Response - Administrators can interact and make any changes to the endpoint except for those actions that are separated into the next two permission levels.
- Execute Live Response Processes - Administrators can launch any process.
- Dump Memory and Remove Live Response - Administrators can perform a full memory dump and can permanently un-enable Live Response.
The Live Response v6 API is now available. The Live Response v6 API uses the Custom API Key type. Modern integrations can use a single Custom API key across a larger number of the Carbon Black Cloud APIs.
The commands exec, execfg, and memdump are separated into two new permission levels to provide added security granularity. All default roles and custom roles continue to have the same access to all Live Response commands except one: by default, the Level 2 Analyst role no longer has the permissions to run these commands.
For more information, see Live Response API releasing v6: now with granular RBAC! on the Carbon Black Cloud User Exchange.
RBAC improvements for Workload Management
Image Scanning permissions: Scan Workload Image and Manage Image Vulnerability Exceptions let you create custom access levels to generate API keys for different use cases (for example, scan images in the cloud).
RBAC improvements for VMware Workspace ONE Intelligence
Carbon Black Cloud and Workspace ONE Intelligence have updated the existing integration to be more seamless, thereby building towards VMware’s vision of Intrinsic Security.
A new Access Level named VMware Workspace ONE Intelligence can be used to generate API Keys that enable Workspace ONE Intelligence to ingest richer Carbon Black Cloud telemetry and to remediate incidents through SOAR workflows.
Data Forwarder Configuration User Interface
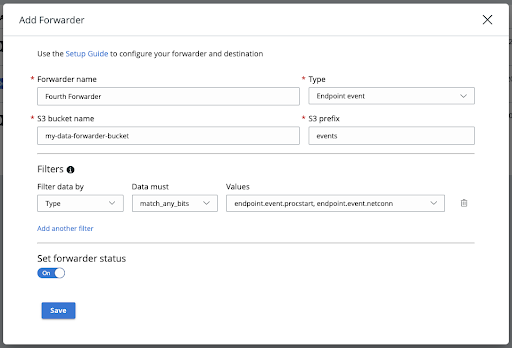
The Carbon Black Cloud Data Forwarder (previously known as the Event Forwarder) now offers a Data Forwarder settings page. This page lets you easily add and configure data forwarders that you previously had to set up using the Event Forwarder Configuration API.
- The Data Forwarder page eliminates the need to create a custom API Access Level and a custom API Key.
- Integrated health check access confirms that the AWS S3 bucket is ready to start receiving forwarded Carbon Black Cloud data, whether you enable the forwarder immediately or not.
- You must set up and configure the AWS S3 bucket to store the forwarded events, including applying the appropriate Bucket Policy.
- These steps are documented in the Data Forwarder Setup Guide.
You can find this page under Settings > Data Forwarder.
To set up a new Forwarder, click the Add Forwarder button and configure the parameters:
Efficacy improvements
- Added better TTP tagging for rundll32.exe turning off registry keys that control logging of certain behavior.
- False positive reductions for CCleaner, LogMeIn, Kaseya, and Firefox performing behaviors that are normally suspicious.
A new permission, View Image and Manage Image Exceptions, provides developers with limited access to container image information and vulnerability exceptions. A new role called Kubernetes Security Developer has been added, together with the super-admin role adjustment to include the newly added permission.
Carbon Black Cloud’s upcoming Container Image Scanning capability introduces a new command-line interface (CLI) utility for customers to interact with the new suite of features. To support the utility’s interaction with Carbon Black Cloud, a new Access Level named Container Image Command Line Interface generates API keys that enable it to scan container images and validate them against customizable security policies.
The VMware Carbon Black Cloud Workload appliance 1.0.2 is a maintenance release containing security updates and improvements based on customer feedback.
Security Advisory (VMSA-2021-0005)
The VMware Carbon Black Cloud Workload appliance 1.0.2 update addresses a security vulnerability where a URL on the administrative interface could be manipulated to bypass authentication.
For more information about this release, see VMware Carbon Black Cloud Workload 1.0.2 Release Notes.
The following table provides a general timeline for when you can expect to see these changes in the VMware Carbon Black Cloud console. Please reference the URL that appears in your browser when you sign into the Carbon Black Cloud console.
| Login URL | ETA |
| https://dashboard.confer.net/ | March 17 |
| https://defense.conferdeploy.net | March 18 |
| https://defense-prodsyd.conferdeploy.net/ | March 17 |
| https://defense-prod05.conferdeploy.net | March 17 |
| https://defense-eu.conferdeploy.net | March 18 |
| https://defense-prodnrt.conferdeploy.net/ | March 18 |

- Linux: new detections for cryptojacking behavior where malware would attempt to quietly mine cryptocurrency, particularly Monero, on endpoints.
- Linux: new detections for fileless attacks, refocusing from a broad approach to specific suspicious behaviors, such as encoded commands and executing from command line arguments.

We added the ability to dynamically exclude Kubernetes workloads from policy rules using an exact or partial match for the workload name. With Policy Dynamic Exception, an exception can apply to all instances of a workload within the selected scope. This supports policies per application (namespaces) that are deployed across many clusters like Kube-system.
The following table provides a general timeline for when you can expect to see these changes in the VMware Carbon Black Cloud console. Please reference the URL that appears in your browser when you sign into the Carbon Black Cloud console.
| Login URL | ETA |
| https://dashboard.confer.net/ | March 2 |
| https://defense.conferdeploy.net | March 3 |
| https://defense-prodsyd.conferdeploy.net/ | March 2 |
| https://defense-prod05.conferdeploy.net | March 3 |
| https://defense-eu.conferdeploy.net | March 3 |
| https://defense-prodnrt.conferdeploy.net/ | March 3 |
- Increase customer visibility for the top requested features.
- Communicate updates regularly on requested features to interested customers.
- Increase visibility into requests we’ve chosen to archive and why.
- Allow customers to weigh in on items outside of highly requested items.
The Voice of the Customer page creates an improved forum for customers to track progress on features that are in development. It provides additional opportunities for customers to provide feedback during development.
For existing customers:
VMware Carbon Black strongly recommends that you enable this feature to ensure your organization is protected against new malware and other potentially harmful unknown binaries. This feature significantly assists in classifying new malware and increases reputation efficacy. Customers who want to prevent uploads from sensitive file paths or locations can do so in Policies > Prevention > Uploads.
- Added new Linux detections, including some detections for the Shellshock bug family.
- Refined many Solarwinds-related detections based on customer false positives.
- Tuned down some of the monitored/observed alerts for Linux to reduce noise.
- New prevention capabilities focusing on Emotet document TTPs. This prevention rule targets Office documents that contain macros that leverage WMI to evade process lineage detection and prevention rules. Note that this rule requires Windows 10 and Office 365/2019 and later versions.
- New Detection/Prevention heuristics for the following:
- Behaviors related to tools that can dump the memory of running processes to disk via scripting languages like PowerShell, and known keylogging capabilities that can be run in PowerShell.
- Targeting highly suspect ransomware behaviors that can be executed with scripting languages like PowerShell.
- On the Watchlists page, you can now differentiate between watchlist types (third party feeds or custom watchlists) at a glance. Sorting watchlists by type is also added.
- To improve page performance, the Investigate and Process Analysis pages now include an exponential backoff when retrieving search results. The backoff timing is calibrated to align with average search completion times.
The Reputation Overrides API is now available for Endpoint Standard customers. This API enables customers and partners to automate the management of hashes, certificates and IT Tools to their organization's Allow List or Banned List:
- The operations you perform with this API are reflected in the Reputations page in the Carbon Black Cloud console, and in the Deny/Block, Terminate, or Allow reactions performed by Endpoint Standard sensors.
- You can add, edit, delete, search, and export reputation override records for your organization.
- Requirements: this API is currently supported for Endpoint Standard customers.
- In the future, this API will be supported for customers who have Enterprise EDR but not Endpoint Standard. Until then, Enterprise EDR-only customers can manage their organization's reputation overrides; however, such reputation override configurations will have no effect on CBC sensor enforcement of banned hashes.
Notes:
- The values used on request and response for the sha256 field are currently named BLACK_LIST and WHITE_LIST; they will be updated later this year in accordance with our Eliminating Offensive Terminology announcement in 2020.
- This API will be integrated soon into the Reputation page on the Carbon Black Cloud console.
- See API documentation on Developer Network.
January 25, 2021
The following table provides a general timeline for when you can expect to see these changes in the VMware Carbon Black Cloud console. Please reference the URL that appears in your browser when you sign into the Carbon Black Cloud console.
| Login URL | ETA |
| https://dashboard.confer.net/ | January 25 |
| https://defense.conferdeploy.net | January 26 |
| https://defense-prodsyd.conferdeploy.net/ | January 25 |
| https://defense-prod05.conferdeploy.net | January 26 |
| https://defense-eu.conferdeploy.net | January 26 |
| https://defense-prodnrt.conferdeploy.net/ | January 26 |
- FireEye: (https://community.carbonblack.com/t5/Threat-Research-Docs/TAU-TIN-FireEye-Red-Team-Tools/ta-p/98376)
- SolarWinds: (https://community.carbonblack.com/t5/Threat-Research-Docs/TAU-TIN-SolarWinds-SUNBURST-Solarigate-Inc...)
December 22, 2020
VMware Carbon Black announces the general availability of VMware Carbon Black Cloud Container Essentials.
VMware Carbon Black Container Essentials is a container security product that protects workloads that are running on multiple Kubernetes clusters, either on-premises or in the public cloud. It provides continuous visibility, security, and compliance for the full lifecycle from CI/CD to production. It helps you to understand the security posture of workloads running in Kubernetes, prioritizes the risk associated with each workload, and helps you resolve misconfigurations. You can use policies and predefined policy templates to harden clusters and prevent deviation from a secure configuration.
- Dashboard - Provides visibility into your security posture across multiple clusters and namespaces.
- Compliance & Policy Automation - Create automated policies to enforce secure configuration and to ensure compliance with organizational requirements and industry standards such as CIS benchmarking. Detect and prevent misconfiguration from build to deployment.
- Prioritized Risk Assessment - Prioritize the most severe risks to your Kubernetes environment to detect and prevent misconfigurations before containers are deployed. Scan Kubernetes manifests at continuous integration (CI/CD) and on Kubernetes clusters.
- Governance & Enforcement - Ensure your Kubernetes configuration integrity through control and visibility of workloads that are deployed to your clusters. Customized policies enforce secure configuration by blocking or alerting on exceptions.
User documentation
- In-product User Guide available from the Help menu
- In-product onboarding available in the Getting Started widget on the Dashboard
- Carbon Black Cloud Sensor Installation Guide
- Operating Environment Requirements (OER)
December 16, 2020
The following table provides a general timeline for when you can expect to see these changes in the VMware Carbon Black Cloud console. Please reference the URL that appears in your browser when you sign into the Carbon Black Cloud console.
| Login URL | ETA |
| https://dashboard.confer.net/ | December 16 |
| https://defense.conferdeploy.net | December 17 |
| https://defense-prodsyd.conferdeploy.net/ | December 16 |
| https://defense-prod05.conferdeploy.net | December 17 |
| https://defense-eu.conferdeploy.net | December 17 |
| https://defense-prodnrt.conferdeploy.net/ | December 17 |

CIDR notation support
Subnet criteria can now be defined using CIDR notation. The Console accepts CIDR notation ranges from 1 to 24 bits.
- When creating a user in the Carbon Black Cloud, the product now checks to make sure that the email address is unique across the entire Carbon Black Cloud environment.
- Partners and multi-tenant customers can create email notification rules for themselves in any org to which they have access by going to Settings > Notifications in the org where they want to create the rule.
Alert search API improvements
Time criteria filters now support ranges based on months using the unit M.
- Added new detections, including one related to Reg.exe attempting to export the Security Account Manager registry file, and one related to PowerShell executing certain encoded commands.
- TTPs from the MITRE Framework v7.0 update are added to existing detections, and a few new conditions are added for MITRE TTPs.
- Various false positive reductions have been implemented, including some for Linux scripts executing common IT tasks.

- Adds childproc_cmdline to childproc events in the Process Analysis events table.
- Updates IP address column headers on the Networks subtab on the Investigate page. Adds a new Direction column. Adds the ability to display IPv6 addresses in existing columns.
- Adds the ability to configure the time window for viewing watchlist hits on the Watchlists page (previously fixed to 3 days). Moves watchlist sorting controls into headers, which is identical to how other tables work.
December 7, 2020

- Policy-based USB Device Blocking: Gain an additional layer of protection and strengthen overall security posture with the ability to block read, write, and execute actions on a per-policy basis.
- Flexible USB Device Approved List: Enable designated external devices with read/write/execute permissions, including flexible approval options for enabling distinct USB devices, or enabling broader manufacturer- or product-based permissions across your environment.
- Alert on Block: Receive notifications of USB device blocks in your environment, and easily approve devices directly from the alert. Users also receive notifications when attempting to use blocked devices, thereby educating them on company policy.
- USB Device Inventory: Gain visibility into all supported USB devices connected to your network with the ability to view, filter, search, and approve USB devices from the Inventory page.
You must be running the latest 3.6.0.1897 Windows sensor version or greater, and have an administrator role with Device Control permissions. Legacy roles such as Live Response Admin are not supported and do not have access to Device Control. Please see the following KB article for questions: Which Roles Are Required For Device Control?. See also:
- Getting Started with Device Control in Endpoint Standard
- How to Create Approvals for USB Storage Devices
- How to Create Blocking Policies
- How to View and Manage USB Storage Device Inventory
- How to View and Manage Alerts
- API Documentation
November 11, 2020
The following table provides a general timeline for when you can expect to see these changes in the VMware Carbon Black Cloud console. Please reference the URL that appears in your browser when you sign into the Carbon Black Cloud console.
| Login URL | ETA |
| https://dashboard.confer.net/ | November 11 |
| https://defense.conferdeploy.net | November 11 |
| https://defense-prodsyd.conferdeploy.net/ | November 11 |
| https://defense-prod05.conferdeploy.net | November 12 |
| https://defense-eu.conferdeploy.net | November 12 |
| https://defense-prodnrt.conferdeploy.net/ | November 12 |
We've made some design changes to update the look and feel of the VMware Carbon Black Cloud console and provide a more seamless experience across solutions. Next time you sign in, you’ll notice:
An updated Sign-in page
Updated branding in the top banner
Updated navigation and menu styles
These changes will be reflected in all of our solutions including Endpoint Standard, Enterprise EDR, and Audit and Remediation. These are solely visual changes and do not affect the functionality of the pages.
Endpoint Standard
Efficacy improvements
Fixed a bug where the Endpoint Standard sensor was correctly blocking malware from running and the cloud detection analytics were correctly generating an alert, but the alert did not have the correct ThreatCategory of KNOWN_MALWARE.
Reduced false positives for some Windows email clients spawning certain target processes.
More TTPs from the MITRE Framework v7.0 update have been added to existing detections.
November 9, 2020
Investigate page update
We have added Alert ID and Alert Category filters to the Enriched Events tab on the Investigate page.
Coming in the next release - Visual changes to the Carbon Black Cloud
an updated Sign in page
updated branding in the top banner
updated navigation and menu styles
November 4, 2020
osquery version update (v4.5.0)
The syntax validator on the SQL tab and the link to the osquery schema now uses osquery schema version 4.5.0, which aligns with the schema versions released in the latest sensors.
This version of osquery adds support for a new non-evented table to query the Windows event log table. This version also includes Windows support for the existing yara table and no longer requires an on-disk signature to be present.
Additional recommended queries
Eleven new recommended queries have been crafted by our Threat Analysis Unit (TAU) team, utilizing new tables from the new osquery version (4.5.0) as well as a few queries to help detect and gather information related to the recent vulnerability CVE-2020-1472.
Go to New Query > Recommended to run or schedule these new queries.
October 29, 2020
VMware Carbon Black is pleased to announce the general availability of VMware Carbon Black Cloud™ Workload. VMware Carbon Black Cloud Workload is a data center security product that protects workloads running in your vSphere environment. It includes core capabilities such as agentless deployment and lifecycle management, vSphere workload inventory, and vulnerability assessment. It also includes prevention, detection and response capabilities such as Audit and Remediation, Next-Gen Antivirus (NGAV), real-time threat hunting, and Endpoint Detection and Response (EDR). This solution provides the following benefits:
Integrates with VMware vSphere to simplify operations for IT and security teams
Provides risk-prioritized vulnerability assessment
Reduces the attack surface and hardens workloads
Blocks both known and unknown attacks - including malware, fileless, and living-off-the-land attacks
Increases visibility across your environment
For more information, please see VMware Carbon Black Cloud™ Workload and VMware Carbon Black Cloud Workload Release Notes.
October 26, 2020
The following table provides a general timeline for when you can expect to see these changes in the VMware Carbon Black Cloud console. Please reference the URL that appears in your browser when you sign into the Carbon Black Cloud console.
| Login URL | ETA |
| https://dashboard.confer.net/ | October 26 |
| https://defense.conferdeploy.net | October 26 |
| https://defense-prod05.conferdeploy.net | October 26 |
| https://defense-eu.conferdeploy.net | October 26 |
| https://defense-prodnrt.conferdeploy.net/ | October 26 |
The policy page was recently updated to accommodate paths that contain commas. Therefore, commas are no longer used as path separators in the text box. New lines will be used instead.
October 14, 2020
The following table provides a general timeline for when you can expect to see these changes in the VMware Carbon Black Cloud console. Please reference the URL that appears in your browser when you sign into the Carbon Black Cloud console.
| Login URL | ETA |
| https://dashboard.confer.net/ | October 14 |
| https://defense.conferdeploy.net | October 15 |
| https://defense-prod05.conferdeploy.net | October 15 |
| https://defense-eu.conferdeploy.net | October 15 |
| https://defense-prodnrt.conferdeploy.net/ | October 15 |
Newly added filters enable defined datasets to be exported and integrated into other systems and tools. By using these filters, you can:
Reduce the volume of data that is transported through the Event Forwarder to your S3 bucket.
Be more prescriptive about the context that you are pulling in from the Carbon Black Cloud console.
Create multiple Event Forwarders to achieve more advanced use cases.
Carbon Black Cloud customers who are using the Event Forwarder now have additional capabilities to filter the endpoint.event dataset. Users of the Event Forwarder can filter on Event Origin, Event Type, Alert ID and/or Sensor Action. For complete documentation, see the Carbon Black Cloud Event Forwarder page on the VMware Carbon Black Developer Network.
Platform search API
The Platform Search API and documentation are now available. Major changes include the following:
Expanding support of our SaaS-native Search API that is used in Enterprise EDR to include Endpoint Standard customers who are on the Unified Platform Experience.
Adding Developer Network documentation in the Platform APIs category. This refreshed and expanded documentation covers:
Expanded documentation of all request and response fields for each endpoint in the Processes and Enriched Events categories, as well as rich examples.
Expanded documentation for every available search field, specifying which fields are searchable, which fields can be returned from specific API endpoints, the complete list of possible values for each enum field, and which sensor versions and products are required (for those fields that are limited to specific products or sensors).
Preview for three new additions to the Platform Search API:
Process Details — returns all available data about one or more specified processes on your managed assets.
Enriched Event Details — returns all available data about one or more specified events on your managed assets.
V2 of the Summary endpoint — improved fidelity of returned data that includes the ability to narrow your request to specific time ranges.
MITRE officially released version 7 of their ATT&CK Framework in July 2020, which included support for sub-techniques. Our threat research team has been working diligently to update our in-product mappings to this new format, so that organizations using MITRE can easily map events in their Carbon Black Cloud solutions to the updated framework. We are happy to announce that the following products are now mapped to these new MITRE ATT&CK technique IDs:
Enterprise EDR
Endpoint Standard
For more context from MITRE on why this change was necessary, exact details of the changes, and a comprehensive definition of sub-techniques, see the following detailed blog post from the MITRE ATT&CK team: https://medium.com/mitre-attack/attack-with-sub-techniques-is-now-just-attack-8fc20997d8de
Updated October 20, 2020
A scheduled config change was released to update our retention policy for notification data downloaded using the API endpoint /integrationServices/v3/notifications.
Notifications provide a queue of recent alerts; to ensure continued reliability and scale, the Notifications will now age out after one week. Customers using this endpoint must poll frequently enough to retrieve their notifications within that window, or utilize one of the other mechanisms available to retrieve this data.
Use the Event Forwarder to stream alerts to your own S3 bucket, where you can control retention.
Use the Alerts v6 API to search up to 180 days of historical alert data.
See the following:
Endpoint Standard
This section of the release notes highlights enhancements that Carbon Black is making to prevention policies. These proactively strengthen our defenses based on recent threat intelligence, and deliver a better user and product experience.
In this release, we’ve made several updates to our detection/alerting processes to reduce the number of false positive alerts that standard business applications and processes generate. These changes should reduce the number of alerts that you receive, thereby allowing you to focus your security resources on priority threats. These updates include improved analytics logic to reduce alert volume that is associated with frequent, benign behaviors from the following:
IT tools that are commonly leveraged on the Windows operating system.
Remote support software from certain hardware vendors.
Software that simplifies non-persistent (VDI) Windows computing environments.
October 12, 2020
It is possible (although not recommended) to create a single IOC in a Watchlist Report that contains multiple comma-separated queries.
The Watchlist Report page previously provided one Investigate link that searched on the first query. This page will now separate out the queries in a single IOC and provide an Investigate button for each query.
For example:
September 28, 2020
This feature is available for Carbon Black Cloud Windows sensors version 3.6 or later.
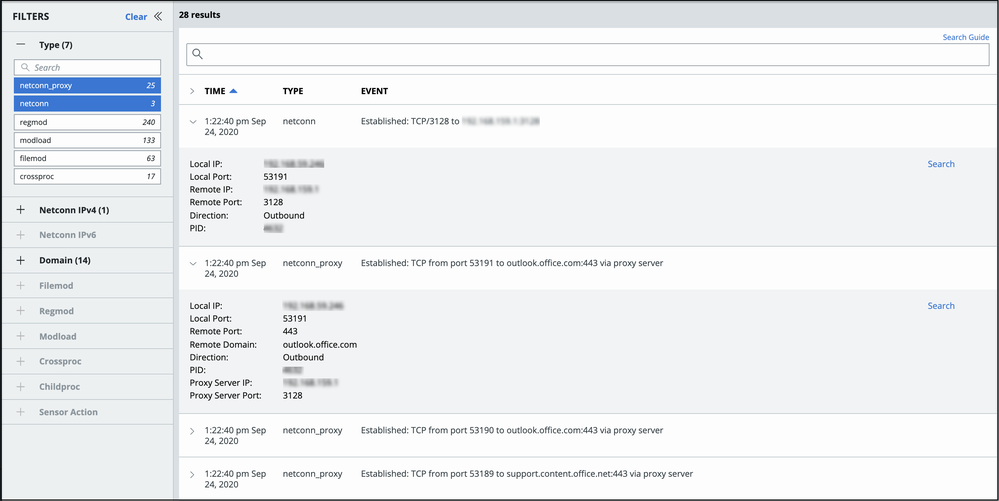
Where an unencrypted HTTP proxy is explicitly configured on a Windows endpoint, two additional sets of data appear on the Process Analysis page:
The IP address and port of the intermediary device (proxy server)
Subsequent netconn connections to proxied destinations
In the following example, the first event is a traditional netconn event type, followed by proxied requests that are routed through the HTTP intermediary. These are classified as netconn_proxy event types.
Note: This mechanism does not always detect a proxy server, but will sometimes detect another form of HTTP-intercepting intermediary network device.
This reporting mechanism interprets specific HTTP headers to report new data when certain combinations of httpRequest and httpHost headers are detected; that is, only when the httpHost header is populated AND only when the httpRequest is an absolute URI.
For example, "httpRequest": "GET / HTTP/1.1" is reported as a traditional netconn. However, "httpRequest": "GET https://carbonblack.com HTTP/1.1" will now be reported using the new mechanism.
Support does not extend to encrypted proxy servers (e.g. proxy servers that use the HTTPS protocol), or to transparent proxies (devices that transparently redirect requests to external destinations).
The following fields are now available for searching on the Process Analysis page search bar:
netconn_proxy_port
netconn_proxy_ipv4
netconn_proxy_ipv6
netconn_proxy_domain
The netconn_proxy_domain field is also returned in the /events/{process_guid}/_search response when reported by the Windows 3.6 sensor.
September 21, 2020
The following table provides a general timeline for when you can expect to see these changes in the VMware Carbon Black Cloud console. Please reference the URL that appears in your browser when you sign into the Carbon Black Cloud console.
| Login URL | ETA |
| https://dashboard.confer.net/ | September 21 |
| https://defense.conferdeploy.net | September 22 |
| https://defense-prod05.conferdeploy.net | September 22 |
| https://defense-eu.conferdeploy.net | September 22 |
| https://defense-prodnrt.conferdeploy.net/ | September 22 |
API users can now filter alert searches by last_update_time. New integrations with the alerts API can take advantage of this filtering option to query alerts within a given time range. The last_update_time represents when the alert is made available to the console and API, and is a reliable way to capture all alerts in the system.
August 31, 2020
VMware Carbon Black Training is migrating to VMware systems to provide a consistent education experience for all VMware customers, partners, and employees. We are happy to bring you the VMWare Carbon Black Cloud Fundamentals course delivered through the VMware Learning Zone. The VMware Learning Zone is your single source for digital training from VMware. 24/7 access to training delivered by top VMware experts and Certified Instructors lets you learn when, where, and how you want. Creating a free basic account grants you access to the VMware Carbon Black Cloud Fundamentals along with many additional VMware courses.
Click Training in the Help menu to go to the VMware on-demand learning site: https://vmwarelearningzone.vmware.com/oltpublish/site/program.do?dispatch=showCourseSession&id=1da8e...
The following search fields have been added only for Endpoint Standard customers who have migrated to the new Unified Platform Experience.
The new search fields require the Windows 3.6 sensor or later to generate the underlying data. These fields are searchable on the Investigate page (and the related Enriched Events search API endpoints), the Process Analysis page, and the related Events search API endpoint):
scriptload_content - Deobfuscated script content loaded from the filesystem at launch of the process. Can be string, binary or raw executable image. Compare with fileless_scriptload_cmdline, process_loaded_script_name. Tokenized. Requires Windows 10/Server version 1703 or later (see https://community.carbonblack.com/t5/Knowledge-Base/Enterprise-EDR-What-Version-of-the-Sensor-Suppor...).
scriptload_content_length - Size in number of characters of the deobfuscated script content loaded from the filesystem. Compare with fileless_scriptload_cmdline_length. Requires Windows 10/Server version 1703 or later (see https://community.carbonblack.com/t5/Knowledge-Base/Enterprise-EDR-What-Version-of-the-Sensor-Suppor...).
AMSI Prevention and visibility
VMware Carbon Black Cloud has extended its default prevention capabilities for script-based Windows attacks, built on Microsoft Anti-Malware Scan Interface (AMSI). The extension of the AMSI integration expands on existing PowerShell preventions at a base prevention layer. It adds protection to all Endpoint Standard customers who are running the Windows 3.6 sensor.
This release includes the ability for the sensor to dynamically leverage AMSI metadata to define and configure prevention logic. These updated high-fidelity prevention rules are crafted by VMware Carbon Black's Threat Analysis Unit to include frequently used off-the-shelf attacker frameworks that are regularly seen in script-based attacks.
As a result of these new prevention rules on Windows 3.6 sensors and above, a user in the console might see an alert that reads:
The application [name] ran a script that attempted to execute content identified as known malware. The script contained an attacker toolkit. A Deny policy action was applied.
Endpoint Standard customers on the new Unified Platform Experience
Alert Triage for these alerts is not supported. To view additional alert details:
Endpoint Standard customers on the Unified Platform Experience should use the Investigate page.
Endpoint Standard + Enterprise EDR customers should use the Investigate or Process Analysis page.
Endpoint Standard customers not on the Unified Platform Experience
Investigate, Process Analysis, and Alert Triage are not supported on these alerts until you move to the Unified Platform Experience.
For more information on the Unified Platform Experience, see this post.
Full exposure of PowerShell scripts
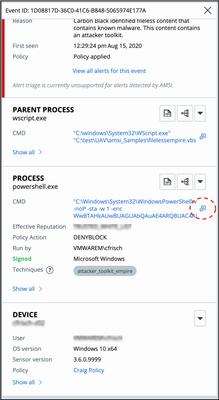
We are releasing a new feature to help you better understand PowerShell executions. By using a program analysis of PowerShell script content, we can translate obfuscated content that is commonly seen in malicious scripts into an easy-to-read and understandable format. You can quickly translate the exact script contents in the Investigate page. Click the translate button to see the entire decoded script together with an assigned risk score.
The VMware Carbon Black Cloud console has also added improved readability of these scripts through syntax highlighting. The highlighting makes it easier to scan for string content versus PowerShell cmdlets and function calls.
This feature is available anywhere that a PowerShell command line is visible in the console.
Enterprise EDR
The following search fields have been added for Enterprise EDR customers, all of which require the Windows 3.6 sensor to generate the underlying data. These fields are searchable on the Investigate page (and in the related Processes and Enriched Events search API endpoints) but are not returned or displayed:
netconn_proxy_domain - Domain name (FQDN) associated with the remote side of an intermediary HTTP network device, usually a proxy server. Tokenized.
netconn_proxy_ipv4 - IPv4 address of the remote side of an intermediary HTTP network device, usually a proxy server. Stored as an integer, not as dotted decimal.
netconn_proxy_ipv6 - IPv6 address of the remote side of an intermediary HTTP network device, usually a proxy server. Stored as a string without octet-separating colon characters.
netconn_proxy_port - TCP or UDP port used by the remote side of an intermediary HTTP network device, usually a proxy server.
August 21, 2020
Now that you have been introduced to the upgraded Search Experience, we have removed that notice from the Investigate page.
The following table provides a general timeline for when you can expect to see these changes in the VMware Carbon Black Cloud console. Please reference the URL that appears in your browser when you sign into the Carbon Black Cloud console.
| Login URL | ETA |
| https://dashboard.confer.net/ | August 17 |
| https://defense.conferdeploy.net | August 18 |
| https://defense-prod05.conferdeploy.net | August 18 |
| https://defense-eu.conferdeploy.net | August 18 |
| https://defense-prodnrt.conferdeploy.net/ | August 18 |
| https://defense-prodsyd.conferdeploy.net/ | August 17 |
Carbon Black Cloud
Update up to 10,000 sensors at a time
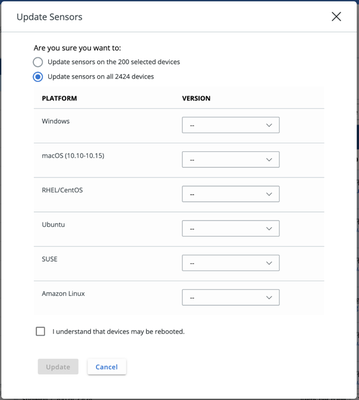
On the Endpoints page, select at least one device and then click Take Action > Update sensors. A radio button titled Update all devices matching search allows you to target up to 10,000 sensors for a single update.
Sensor update status
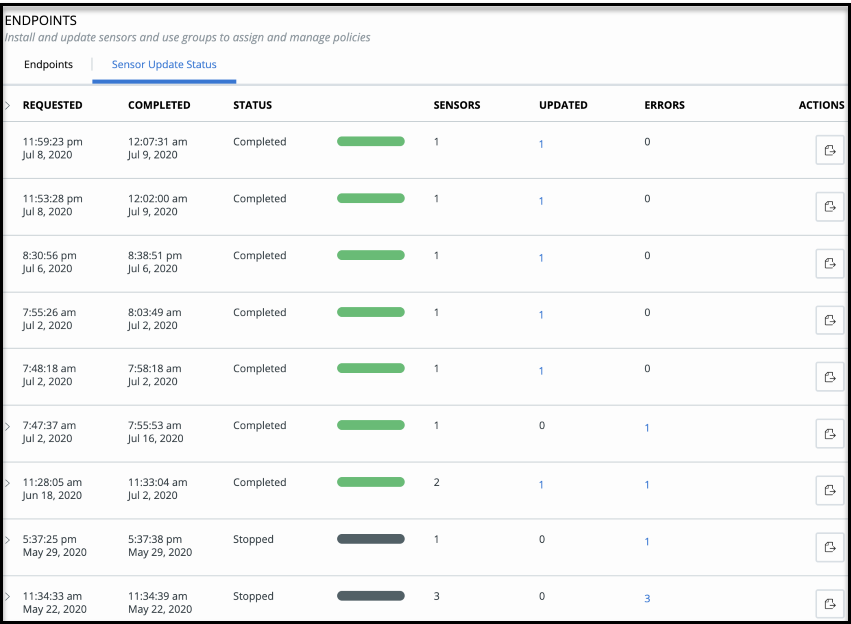
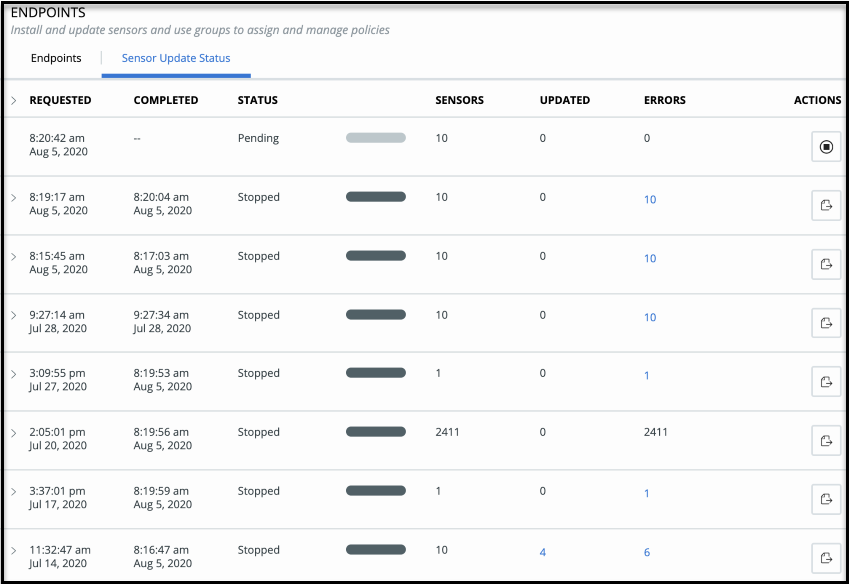
On the Endpoints page, the Sensor Update Status tab displays the most recent 200 sensor updates.
In the Actions column of the Sensor Update Status tab, you can stop incomplete sensor update processes, including Pending or Processing. After an update status is Completed, you can export the results via a csv file.
When a sensor update status displays Completed, a hyperlinked count in the Updated column opens a new browser tab to the Endpoints page, where the sensors that successfully updated display. If any sensors did not update, a hyperlinked count under the Errors column shows the sensors that did not update, and the Sensor Update Status tab displays the reason.
If the Updated or Errors sensor count is greater than 500, the hyperlink is un-enabled, and only the Export option is available under the Actions column. The Export action generates and downloads a csv file with the Updated or Errors count details.
August 3, 2020
In all Carbon Black Cloud products, you can now export larger volumes of data using the Export All button on the dashboard (EA-14505/EA-13452/DSER-16563). The CSV files are generated asynchronously and are then available for download in the Notifications menu.
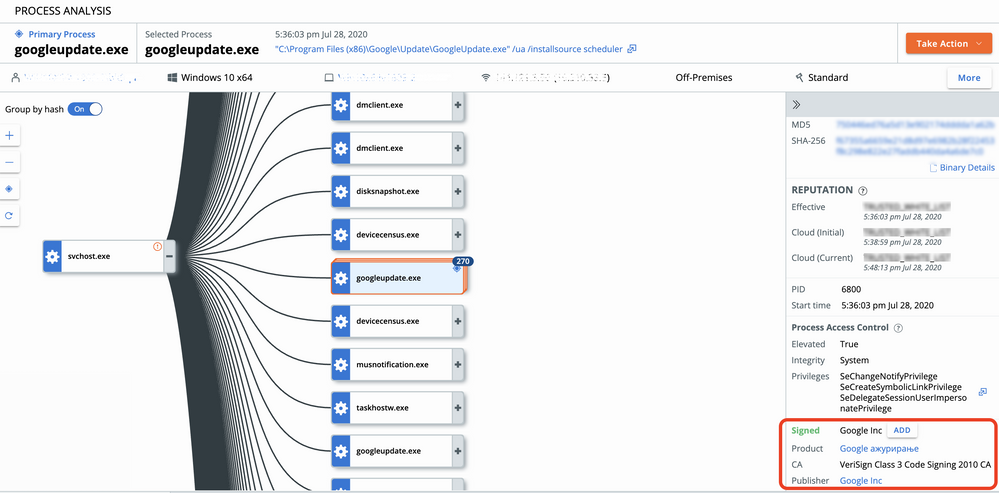
Improved signature data
Investigate - process in the right pane
Process Analysis - right pane
Process Analysis - expanded details for certain events
For example, the data on the Process Analysis page appears here:
These fields are populated with data from the Carbon Black Cloud Unified Binary Store (UBS) API, which is documented here:
https://developer.carbonblack.com/reference/carbon-black-cloud/cb-threathunter/latest/universal-bina...
Known limitation: Endpoint Standard-only customers will continue to see signature data that is available via the existing API. This is also true for current Linux and macOS sensors that do not currently support UBS.
Binary Details page enabled for all Enterprise EDR customers
Alerts page - right pane (Process)
Investigate page - right pane (Parent Process, Process, Child Process)
Process Analysis page updated to use v2 /events/ API endpoints
The following changes to permissions in the Roles pages help unify the Endpoint Standard and Enterprise EDR product experience.
The following permissions have been moved from the Threat Hunting category to Custom Detections:
| Threat Hunting permission name | Custom Detections permission name |
| Manage Third Party Watchlists | Manage Watchlist Feeds |
| View Third Party Watchlists | View Watchlist Feeds |
| Manage Watchlists | Manage Watchlists |
| View Watchlists | View Watchlists |
We consolidated redundant permissions from the Threat Hunting category into the Investigate category's Conduct Investigations permission:
Manage events
View events
Existing and custom roles are preserved. The Threat Hunting category has been removed, but its previously held permissions remain.
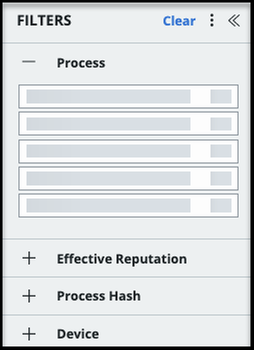
Investigate page adds placeholders to Filters
The following table provides a general timeline for when you can expect to see these changes in the VMware Carbon Black Cloud console. Please reference the URL that appears in your browser when you sign into the Carbon Black Cloud console.
| Login URL | ETA |
| https://dashboard.confer.net/ | July 16 |
| https://defense.conferdeploy.net | July 20 |
| https://defense-prod05.conferdeploy.net | July 20 |
| https://defense-eu.conferdeploy.net | July 20 |
| https://defense-prodnrt.conferdeploy.net/ | July 16 |
Carbon Black Cloud
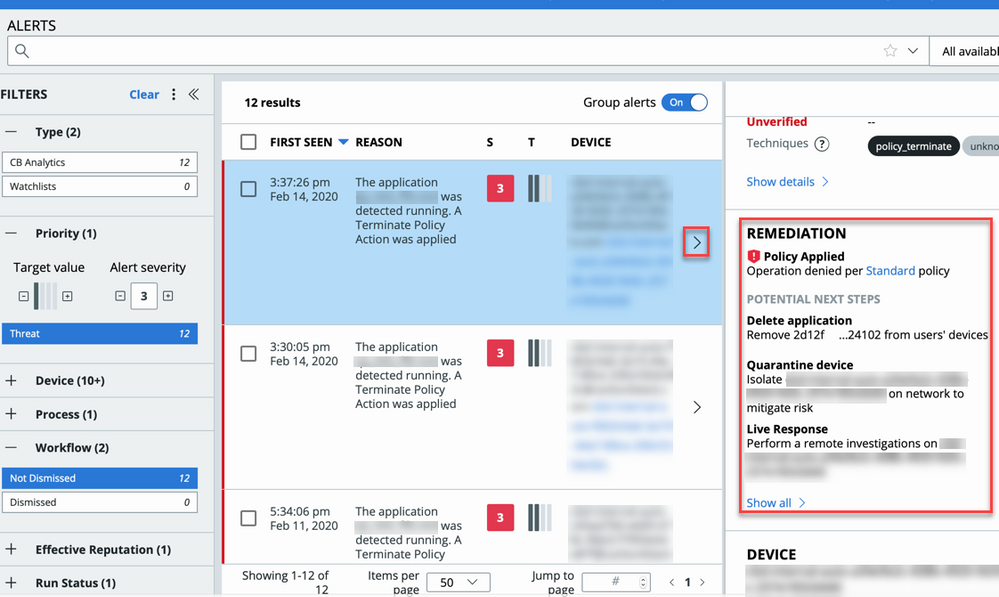
Remediation suggestions for Alerts
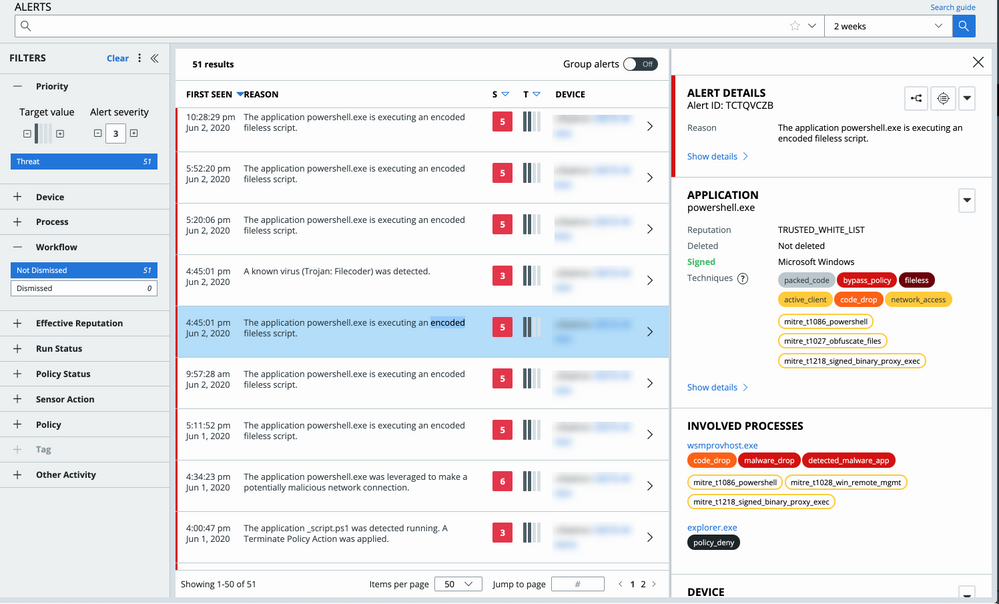
A new Remediation section is available on the Alerts page. Click the > next to the alert to open the right panel and view potential remediation actions for detections, preventions, and watchlist hits, based on your permission level. This capability is available to Enterprise EDR, Endpoint Standard with Enterprise EDR, and Endpoint Standard customers with the new unified platform experience.
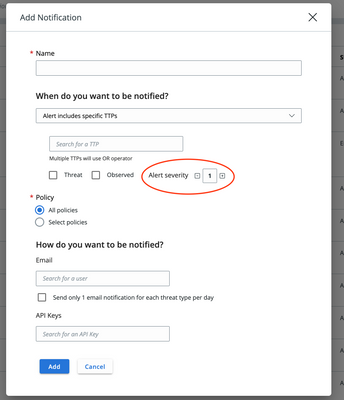
Notification rules alert severity
Alert severity is now available when configuring a notification rule to improve your ability to manage notifications.
Existing notification rules with the type of Alert includes specific TTPs or Policy action is enforced will default to an alert severity of 1 if no other severity is specified. All other notification types remain unchanged.
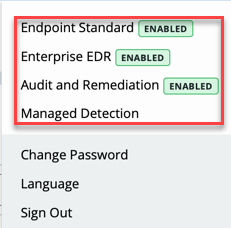
Enabled products are viewable in the console
The dropdown that displays the currently logged-in user now displays the enabled products in the organization. The dropdown includes references to Endpoint Standard, Enterprise EDR, Audit and Remediation, and Managed Detection.
If a product is enabled, a green Enabled tag displays next to the product name. You can click a product name to learn more about that solution on the VMware Carbon Black website.
Enterprise EDR
Shareable Investigate page search result URLs
The Investigate page URL for Enterprise EDR now continuously synchronizes with the current state of search results that are displayed on the page. Any time that you submit a new or edited search, the page will update the URL in the browser address bar.
You can copy the URL and send it to colleagues to perform the same search from their client. This capability improves the clarity of investigations and reduces time to resolution among multiple investigators.
Carbon Black Cloud
Filter counts added
VMware Carbon Black
On pages that provide lists of selectable filters (also known as facets), a count shows how many unique facet entries are available for the currently-displayed results.
This is seen on:
Alerts page
Investigate page
Live Query page - Query Results
For example:
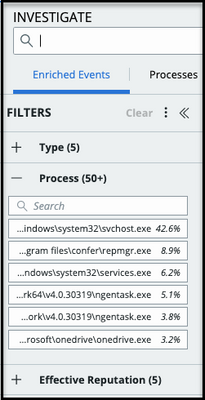
Note: If more filter values are available than the console shows, the count is suffixed with a + symbol.
For example, on the Investigate page, if more than 50 processes are available, you will see Process (50+). That number shrinks as you target your search query.
osquery version update
Simplified search
Investigate page – Processes tab
Process Search v2 API
An entry in the Notifications feature and a message in the Results table of the Investigate page direct you to read Simplifying Search at Scale on the Carbon Black Cloud.
Process Search v2 fields that are now multi-valued
For the v2 Process Search API endpoint /api/investigate/v2/orgs/{org_key}/processes/search_jobs, the following fields return as an array instead of as a single-value string:
enriched_event_type
event_type
event_attack_stage
event_threat_score
Known limitations
The process_name field always reports as the filename of the executing binary. This is different from existing behavior where customers that have Endpoint Standard + Enterprise EDR sometimes see that the process name = "filename of the script being executed by a script host".
In edge cases where the sensor reports a different process start timestamp between the Endpoint Standard and Enterprise EDR versions of events, multiple search results can appear in the Investigate search.
In edge cases where the sensor does not report a process start timestamp, VMware Carbon Black Cloud now inserts a timestamp when the event is received by the backend. This can create multiple search results for the same process.
In some cases, duplicate search results occur for the same process from Windows sensors that are older than the 3.3 generation.
There are edge cases when Enriched events have one or more duplicate records.
There are rare cases when counts might vary by 1 when comparing the same search results between tabs under the Enriched Events tab of the Investigate page. This does not mean that any data has been lost, but that optimization of indexes has not completed. This effect is short-lived, and can create more recent data.
Windows frequently re-uses Process IDs (PIDs). On a Windows endpoint that has significant process create activity, this can lead to two processes that have the same name are being reported with the same process ID, with process create times sometimes only a few minutes apart. This can lead to cases whereby a search for a process_name:xxxxx for one device reports two search results with the same process_pid. The only known cases where this is true are due to aggressive process ID re-use.
Enterprise EDR (formerly CB ThreatHunter)
New Alerts page experience
Enterprise EDR customers can now benefit from a unified experience across the Alerts and Investigate pages. This design makes it easier to search your entire environment to quickly identify potentially malicious behaviors.
Improved Search
Easy and Advanced Search are replaced with a single, improved search experience, similar to the Investigate page.
Search Suggestions provide formatting help, with descriptions of each search value.
Search Fields are standardized to a single, easy-to-use syntax.
Embedded Search Guide is now available inside the console.
Favorite Searches are available user- or organization-wide for frequently reused search queries.
Alert details
Previously, alert details appeared at the top of the pages and associated TTPs appeared when the row was expanded. Now, all alert details are available in this single right panel view. The following cards are available in the right panel:
Alert Details: Contains more context about the alert. Navigate to Alert Triage, Process Analysis, or Investigate, or take action on the alert, process, or device by clicking on the arrow in the top right.
Process: Formerly known as Application, this process card contains information about the primary process that is associated with the alert. Click the arrow in the top right to take action on the process or device.
Involved Processes: When multiple processes are associated with an alert, view the full list of additional processes together with their TTPs. Click the hyperlinked process name to search by device id, alert id, and SHA-256 on the Investigate page.
Device: Quickly view preliminary device details. Click the arrow in the top right to take action on the device.
Notes and Tags: Add a note or a tag for easy filtering.
Export enriched events and processes
You can now export a CSV-formatted data set directly from the Investigate page from the Processes tab or Enriched Events tab (Endpoint Standard + Enterprise EDR).
The time to generate the file varies depending on the size of the export. When the file is available, you will receive a notification to download it.
Audit and Remediation (formerly CB LiveOps)
Dell SafeBIOS Recommended Query
Passed - Verification passed. The local BIOS passed verification against a known-good Dell BIOS.
Failed - Verification failed. The local BIOS failed verification against a known-good Dell BIOS.
Not Available - See the Dell troubleshooting documentation.
Other columns provide information about whether the Dell Trusted Device agent is installed, the version number, the hardware model of the endpoint, and the last run time of the Dell Trusted Device agent. For more information about this query and the Dell partnership, visit the User Exchange.
Dell SafeBIOS - BIOS image capture script
To provide additional visibility and remediation capabilities for BIOS firmware attacks, a Live Response script on our GitHub allows an administrator to capture the BIOS image when SafeBIOS verification returns a “Failed” result. We recommend that you perform further investigation in the case of BIOS failure. This script will help you and your team perform forensic analysis. For more access to the script and more information about how to run it, please visit our GitHub.
Audit and Remediation (formerly CB LiveOps)
Consistency enhancements
The following table provides a general timeline for when you can expect to see these changes in the Carbon Black Cloud console. Please reference the URL that appears in your browser when you sign into the Carbon Black Cloud console.
| Login URL | ETA |
| https://dashboard.confer.net/ | May 20 |
| https://defense.conferdeploy.net | May 20 |
| https://defense-prod05.conferdeploy.net | May 21 |
| https://defense-eu.conferdeploy.net | May 21 |
| https://defense-prodnrt.conferdeploy.net/ | May 21 |
Endpoint Standard (formerly CB Defense)
Improved technique identifier experience
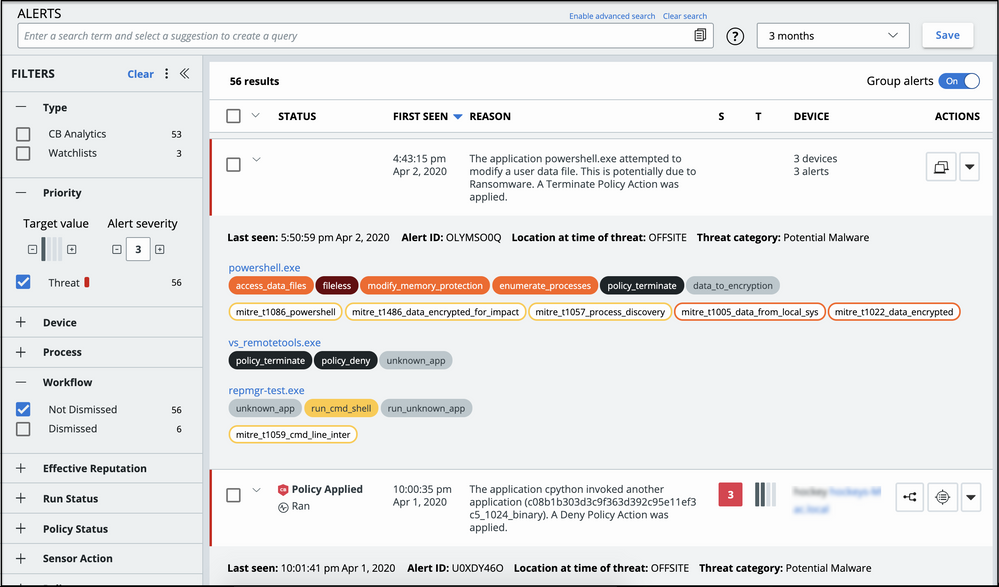
Audit and Remediation (formerly CB LiveOps)
Improvements to CSV Export for large results sets
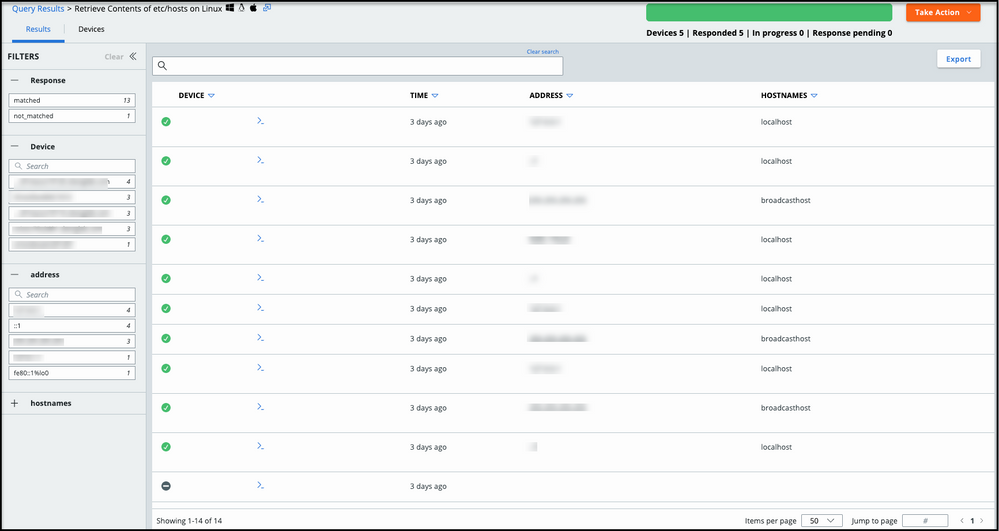
VMware Carbon Black Cloud
Japanese translation


Improvements to the Sensor Kit Download Window
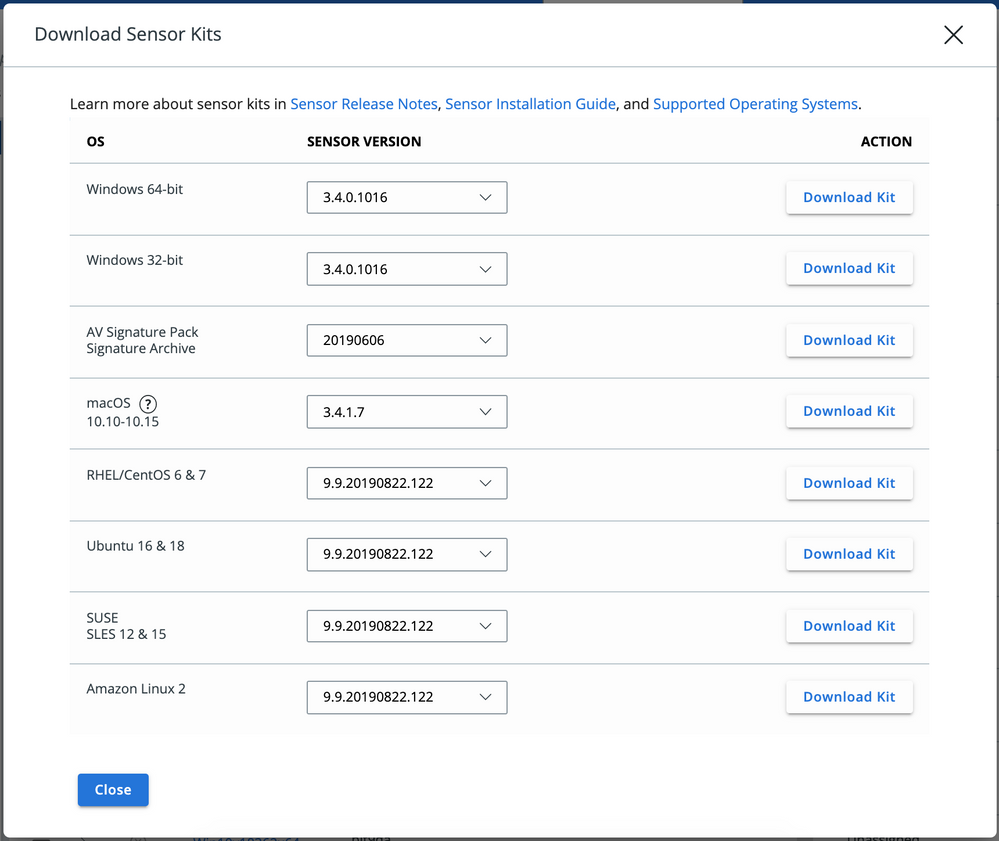
Audit and Remediation (formerly CB LiveOps)
Improved layout for query building page
We updated the layout of both the schedule modal on the Recommended and SQL Query tabs to be consistent and clear by adding headers and changing other minor elements.
We have made it clearer what parts of the form are required for submission. You are now required to enter a name for your query on the SQL Query tab.
Removed the Windows CryptoAPI Spoofing Recommended Query
We have officially removed the query called “Windows CryptoAPI Spoofing Vulnerability (CVE-2020-0601)” from the console. For more information about why and how we are continuing to keep the catalog current and relevant, please read this UEX post.
VMware Carbon Black Cloud
Filtered sub-tabs in Events tab on Investigate page
Applications
Devices
Network
These new sub-tabs provide easy access to the most common views of your endpoint event data.
Applications shows the most prevalent applications across all devices:
Devices shows the devices and how many events have been reported on each:
Network shows a detailed breakdown of relevant network metadata of all netconns:
Improved content on the API access page
We expanded the content in the API and Integration Documentation window to better assist you with API integrations. It includes various links and documentation about integrations.
Operating system selection on the Endpoints page
You can filter endpoints by operating system (Windows, macOS, and Linux). Click the OS dropdown menu and select the endpoints to view.
Audit and Remediation (formerly CB LiveOps)
Improved Query Result page

To provide clarity, we have separated the overall query status from the device's response.
Changes to Watchlist hit counts
When reviewing the events captured by watchlists, Enterprise EDR previously displayed each individual recorded hit.
We simplified the Watchlists page to show a summary of each of the processes that resulted in one or more hits. We clarified the text on the page:Renamed Hits tab to Processes
Updated the results counter from ### results to ### processes with hits
For example, when Chrome is running and making many connections to Google.com, a watchlist searching on netconn_domain:google.com will generate many hits, but only one process with hits.
We have added a PID column to the Results table to make it easier to distinguish two or more records that have the same Report and Process names. The console now reports the data as Processes:
Improved support for fields in Investigate searches
In organizations that use Enterprise EDR watchlists, certain Investigate searches that included the following fields sometimes led to false positive/false negative search results. This is corrected. Searches that previously required adding a -watchlist_id:* (note the "-" prefix) clause can now eliminate that clause from searches.
"scriptload_count"
"device_policy"
"device_group_id"
"process_service_name"
"device_policy_id"
"parent_publisher_state"
"process_company_name"
"process_cmdline_length"
"process_internal_name"
"parent_cmdline_length"
"parent_cmdline"
"device_os_version"
"process_publisher"
"process_publisher_state"
"process_product_version"
"process_original_filename"
"process_file_description"
"process_product_name"
"parent_name"
"process_cmdline"
"process_elevated"
"process_integrity_level"
"process_privileges"
The following table provides a general timeline for when you can expect to see these changes in the Carbon Black Cloud console. Please reference the URL that appears in your browser when you sign into the Carbon Black Cloud console.
| Login URL | ETA |
| https://dashboard.confer.net/ | April 22 |
| https://defense.conferdeploy.net | April 22 |
| https://defense-prod05.conferdeploy.net | April 23 |
| https://defense-eu.conferdeploy.net | April 23 |
| https://defense-prodnrt.conferdeploy.net/ | April 23 |
VMware Carbon Black Cloud
Table column customization
With this release, you can configure which table columns to view across all tables in the Carbon Black Cloud console. You can hide specific columns and customize the order of columns to fit your workflow and maximize screen space.
Audit and Remediation (formerly CB LiveOps)
Access all actions across pages

We have added confirmation for both the Stop and Delete actions on both pages.
Investigate page updates


For analytics alerts, watchlist hits, and watchlist alerts, users can click the badge to get details of the latest alert/hit that is associated with the row that has the highest severity. You can quickly search to see all alerts or hits that are associated with that row.
File modification card improvements
To help minimize the length of investigations, Reputation and Signed By details are added to the Filemod card. Cards in the details view are now expanded to display all relevant context by default.
VMware Carbon Black Cloud
Updated End User Licensing Agreement (EULA)
Endpoint Standard (formerly CB Defense)
Malware protection for Linux
Malware prevention coverage from Linux malware
You can adapt policies for your specific environments (by deny-listing/allow-listing hashes)
View context around blocked and suspected malware (file origination, execution details, etc.)
To add malware coverage for Linux endpoints, contact your Carbon Black representative for help in adding new endpoints to your existing agreement.
Updated messaging
We have updated messaging to make it easier to navigate and differentiate between available Linux features.
In the Send Installation Request window on the Endpoints page, we inform users how to properly install Linux endpoints.
On the Prevention tab on the Policies page, we have included Linux OS icons in the Known malware and Application on the company deny-list rows. Additional messaging signals that Runs or is running is the only option that is available to Linux users.
Audit and Remediation (formerly CB LiveOps)
Additional recommended queries
Secure Boot Status
Unusual User Accounts
Blank Passwords Enabled
Root User Shell History
Detect sdelete.exe Execution
macOS LaunchDaemons
Binaries with SUID or SGID Set
Weak Authentication Types (LM/NTLM)
Investigate and Watchlists support trailing wildcard in process_cmdline searches
The following table provides a general timeline for when you can expect to see these changes in the Carbon Black Cloud console. Please reference the URL that appears in your browser when you sign into the Carbon Black Cloud console.
| Login URL | ETA |
| https://dashboard.confer.net/ | April 1 |
| https://defense.conferdeploy.net | April 2 |
| https://defense-prod05.conferdeploy.net | April 6 |
| https://defense-eu.conferdeploy.net | April 6 |
| https://defense-prodnrt.conferdeploy.net/ | April 6 |
VMware Carbon Black Cloud
Filter selections persist between tabs on the Investigate page
For example, if you select NETWORK_ACCESS from the TTP filter category on the Enriched Events tab and perform a search, and then switch to the Processes tab and submit a search, the Processes search will also filter on ttp:NETWORK_ACCESS.
This improvement lets you continuously explore specified data. You can expand or narrow a search and compare the summary and detailed views of that data very quickly.
Endpoint Standard (formerly CB Defense)
Speed investigation of TTPs with new informational windows
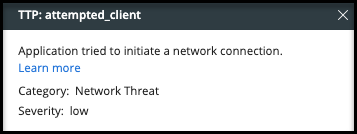
Users can use this new functionality to speed their investigations wherever TTPs appear on the Alerts and Alert Triage pages.
Create_time on alert search API
Alerts v6 Search API now supports sorting by create_time.
Audit and Remediation (formerly CB LiveOps)
SQL syntax assistance
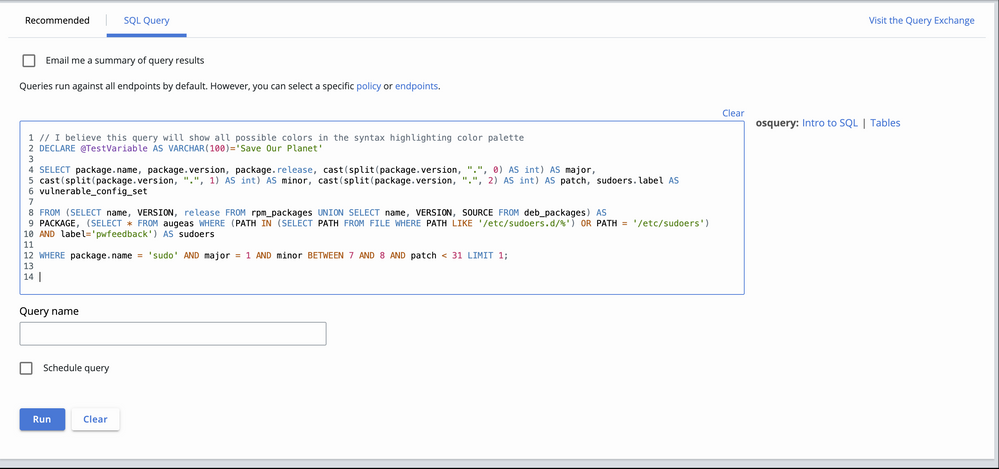
Recommended query for Windows SMBv3 client/server remote code execution vulnerability
A new recommended query for the recent Windows SMBv3 vulnerability (CVE 2020-0796) identifies the following:
If a machine has active SMB shares
If a machine is running an OS version that is impacted by this vulnerability
If the un-enabled compression mitigating keys are set
If the system is patched
Audit and Remediation customers can quickly quantify the level of impact this vulnerability has in their network. Read more about this vulnerability and our recommendations at CVE-2020-0796 - EternalDarkness (ghostSMB).
Go to New Query > Recommended and search for “SMBv3” to run or schedule this query.
We have also updated the Windows CryptoAPI Spoofing Vulnerability (CVE-2020-0601) query to include the latest patches.
Enterprise EDR (formerly CB ThreatHunter)
Collapse nodes on the Process Analysis page

Adjustable filters panel
You can adjust the filters panel so that you can fully view items such as long process names.
Search suggestion improvements
Search suggestions on the Investigate page are improved: the search bar is more responsive as you type.
Improvements on the Watchlists pages
The Watchlists page (select Watchlists from the Enforce group) now shows the final Hits count more quickly.
When you select a subscribed Watchlist, the page initially displays result placeholders while results are being retrieved:
When selecting a subscribed Watchlist, if there are no hits for the past three days, the Hits tab reports "No hits detected."
To refresh the Hits results for a selected Watchlist, click the Hits tab.
Endpoint Standard (formerly CB Defense)
OS icons on the Policies > Prevention and Sensor tabs
Audit and Remediation (formerly CB LiveOps)
Improvements to the SQL query building experience

Similarly, if you try to submit a query with syntactically incorrect SQL, an error will direct you to the location of the syntax error.
API users will receive more informative messages when writing invalid SQL queries. You can find the full Live Query API documentation on the VMware Carbon Black Developer Relations website.
We have added OS icons next to the query name on the individual Query Results page to clearly show the operating systems with which each query is compatible and is successfully running on.
OS icons will not appear for queries written on the SQL Query tab when individual endpoints are selected (via the Endpoints selector). If a query is incompatible with a set of selected endpoints - for example, if you wrote a macOS-only query and sent it to a Windows endpoint - the query is submitted but will not actually run on the Windows endpoints. A status of “Not Supported” is returned.
“Copy (SQL)” is now “Duplicate”: altered content for clarity
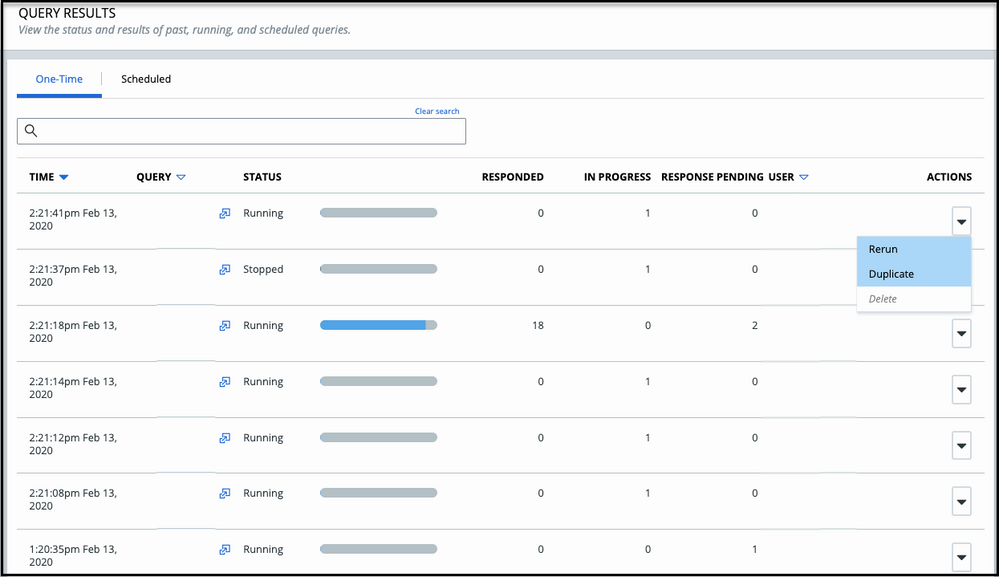
Select Duplicate and a window will appear with the original SQL and endpoint selections pre-populated. Make edits as needed and then click Run. This functionality is also available in the Take Action menu on the individual Query Results page.
Enterprise EDR (formerly CB ThreatHunter)
Process Analysis tree nodes show Deny and Terminate icons
The Process Analysis tree now indicates whether the process was involved in a Deny or Terminate action in the form of red shield icons. This signifies that the process was parent to a process that was Terminated after it started, or to a process that was Denied before it began running.
For example, in the following Process Analysis tree, two instances of FIREFOX.EXE include one or more red shield icons:
The first instance shows the Terminate shield, indicating that an action was Terminated after it began.
The second instance shows the Deny and Terminate shields, indicating that there were two separate events in which the sensor intervened. One shows a Terminated running action, and the other shows a Denied attempted action before it performed any interesting actions.
An orange exclamation point icon indicates that one or more Enterprise EDR Watchlist hits were associated with the process.
VMware Carbon Black Cloud
Improved User Guide print function
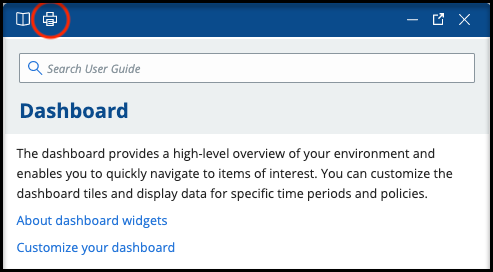
Endpoint Standard (formerly CB Defense)
MITRE Technique IDs

For TTP and TID severity levels, click the question mark icon next to the TTPs title.
You can search for specific MITRE techniques on the Alerts and Investigate pages in the same way that you would search for Carbon Black TTPs.
Audit and Remediation (formerly CB LiveOps)
New recommended queries
Windows Firewall Status
CVE-2019-18634 Vulnerability
Potential socat TTY Misuse or Reverse Shells
Click New Query > Recommended to run or schedule queries using these new terms.
Enterprise EDR (formerly CB ThreatHunter)
New data in Investigate and Process Analysis

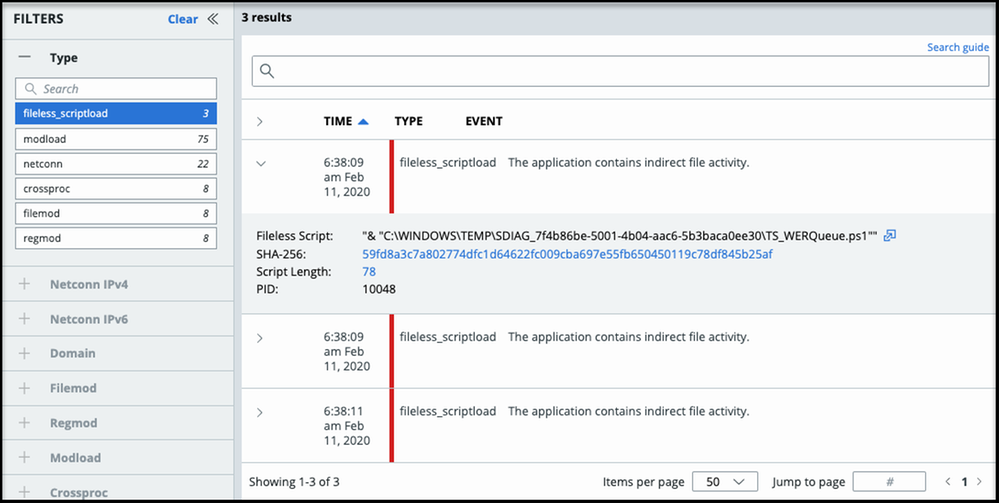

Elevated is shown as True for any process that is/was running in an elevated state; otherwise it is shown as "--" to signify that the sensor has not reported any elevation status.
Integrity reports the process integrity level at which the process is/was running.
Privileges reports each privilege that is contained in the token that authorizes the process to take actions. If there are more than three privileges reported for the process, the console makes the full list available in an expansion window.
This information is displayed in the right pane of the Process Analysis page:
The following is an example of the full list of process privileges that appears when you click the expansion arrow icon in the Privileges section:
New supported search fields
fileless_scriptload_cmdline: Find processes that executed PowerShell commands in fileless execution context; for example, fileless_scriptload_cmdline:System.Management.Automation.Utils.
fileless_scriptload_cmdline_length: Find processes that executed PowerShell commands of certain lengths; for example, fileless_scriptload_cmdline_length:[50 to *].
fileless_scriptload_hash: Find processes that loaded a specific file-less script by its hash value.
process_elevated:true: Find all processes launched in an elevated state via the User Account Control (UAC) feature of Windows.
process_integrity_level: Find all processes that are running at one of the integrity levels defined and enforced by Windows' Mandatory Integrity Control; for example, process_integrity_level:PROTECTED.
process_privileges: Find all processes running with any of the defined privileges in Windows; for example, process_privileges:SeDebugPrivilege.
process_service_name: Find only the svchost.exe processes where the Windows Service matches the internal service name; for example, process_service_name:wsearch.
scriptload_count: Total number of script loads by this process; for example, scriptload_count:[0 TO 5].
scriptload_hash: MD5 and SHA-256 hashes of the loaded script; for example, scriptload_hash:2d75cc1bf8e57872781f9cd04a529256 OR scriptload_hash:c35f705df9e475305c0984b05991d444450809c35dd1d96106bb8e7128b9082f.
scriptload_md5: MD5 of the loaded script; for example, scriptload_md5:2d75cc1bf8e57872781f9cd04a529256.
scriptload_name: Tokenized paths of the scripts loaded by the process; for example, scriptload_name:malware.docx.
scriptload_publisher: Publisher that signed the script, if any; for example, scriptload_publisher:Microsoft.
scriptload_publisher_state: Certificate signature states of the loaded scripts as string; for example, scriptload_publisher_state:FILE_SIGNATURE_STATE_INVALID.
scriptload_reputation: Reputation of the loaded script; for example, scriptload_reputation:TRUSTED_WHITE_LIST.
scriptload_sha256: SHA-256 of the loaded script; for example, scriptload_hash:c35f705df9e475305c0984b05991d444450809c35dd1d96106bb8e7128b9082f.
sensor_action_reason: Find the processes for which the sensor took a specific action; for example, sensor_action_reason:POLICY_DENY.
Investigate Search shows future events
VMware Carbon Black Cloud
v2 Process Search API
There are now two separate API calls to start a search in the console: instead of one request to /processes/search_jobs, there is a search request (to /processes/search_jobs) and a facet request (to /processes/facet_jobs).
The query_id parameter is now search_job_id and facet_job_id (corresponding to the respective API endpoints above).
Note: This update applies to all customers who have CB ThreatHunter, or CB Defense and CB ThreatHunter together. Customers who have CB Defense only will continue to have the same experience as before.
CB LiveOps
30-day data retention
 icon. You can can also delete, copy, or re-run expired queries via the Actions column.
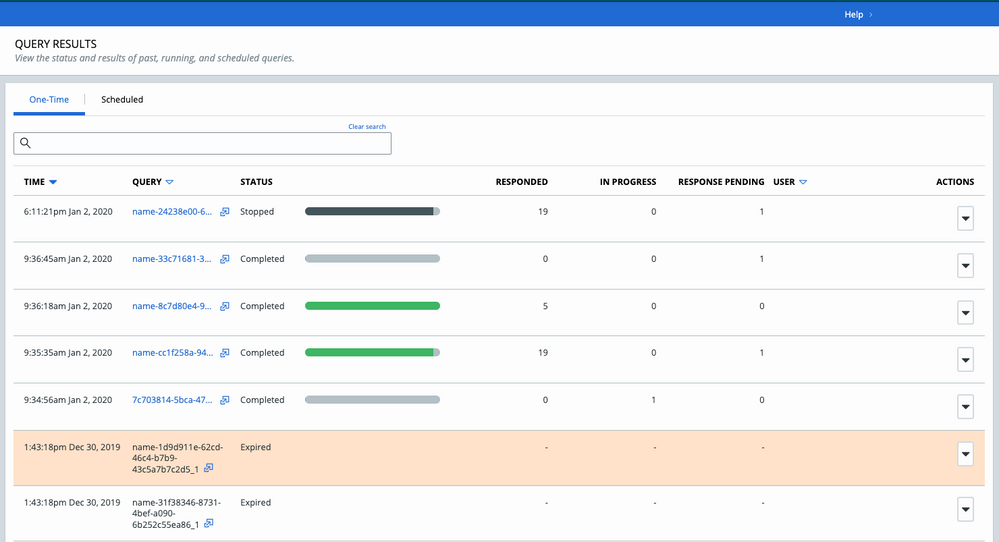
On the Scheduled tab, individual instances of scheduled queries that occurred more than 30 days ago do not appear in the table. For audit purposes, we now track runs of scheduled queries in the Audit Log.
If you try to navigate directly to the individual Query Results page of an expired query via a saved link or bookmark, a notification explains why you were redirected.
The following table provides a general timeline for when you can expect to see these changes in the Carbon Black Cloud console. Please reference the URL that appears in your browser when you sign into the Carbon Black Cloud console.
| Login URL | ETA |
| https://dashboard.confer.net/ | January 30 |
| https://defense.conferdeploy.net | January 30 |
| https://defense-prod05.conferdeploy.net | January 30 |
| https://defense-eu.conferdeploy.net | February 3 |
| https://defense-prodnrt.conferdeploy.net/ | February 3 |
VMware Carbon Black Cloud
Data load visualization
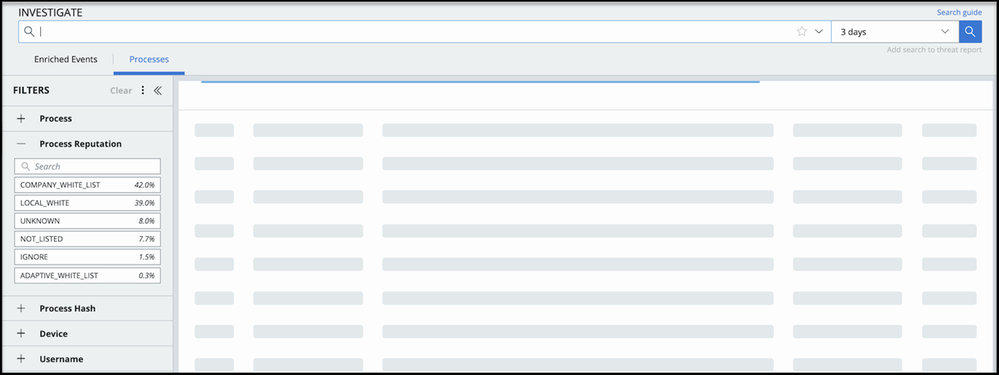
Standardization improvements on Notifications and Malware Removal pages

On the Malware Removal page, a description now appears below the Malware Removal title and the search functionality is moved to the primary table area.
Similar page standardizations are coming soon to other pages in the Carbon Black Cloud, starting with the API Keys page. Check upcoming release notes for details.
CB Defense
Detection enhancements
| Type | Name | Description |
| Enhanced Detection (Windows) | Spearphishing | We implemented an enhanced detection technique to alert users when an email attachment attempts to make a network connection. This enhanced detection is related to spearphishing, a form of targeted phishing attack. |
| False Positive (macOS) | Injection | Resolution of a high-frequency false positive that is occurring on macOS 3.4+ sensors, which is related to shells talking on the network. |
CB LiveOps
New recommended query for Windows CryptoAPI spoofing vulnerability (CVE-2020-0601)
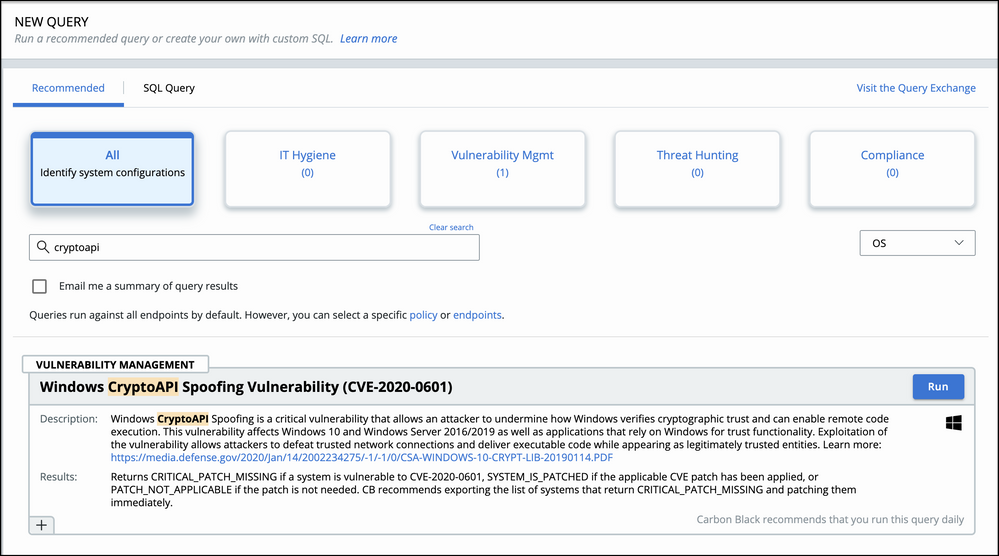
The query returns a list of endpoints and their vulnerability status. VMware Carbon Black recommends exporting the list of endpoints with the status “CRITICAL_PATCH_MISSING” and patching them immediately because that is the only known remediation for this vulnerability. Because the vulnerability only affects Windows 10 and Windows Server 2016 and Windows Server 2019 systems, the query will return “PATCH_NOT_APPLICABLE” for any Windows devices that are not affected (for example, endpoints that are running Windows 7).
To read more about this vulnerability and how Live Query assists with vulnerability management, see Using Live Query to Audit Your Environment for the Windows CryptoAPI Spoofing Vulnerability (CVE-202....
APIs for scheduled queries
The full suite of REST API routes to schedule and manage scheduled queries is now fully documented and publicly available on our Developer Relations website.
CB ThreatHunter
User-level favorite searches

Share process nodes

CB ThreatHunter
New search fields
device_os_version - This data is available from the latest sensors, which report the OS version in which the process was running.
has_children - Calculated by the Carbon Black Cloud at search time to determine if the cloud has any child node records; leveraged by the Process Analysis tree.
process_company_name - The CB ThreatHunter equivalent to the CB Response company_name.
process_internal_name - The CB ThreatHunter equivalent to the CB Response internal_namescriptload_name.
New create-time field in Watchlist alerts
Carbon Black Cloud
New suggested searches

| Search field | Pages |
| childproc_cmdline | Process Analysis |
| childproc_cmdline_length | Investigate |
| childproc_publisher_state | Investigate |
| event_attack_stage | Investigate |
| event_threat_score | Investigate |
| netconn_local_ipv4 | Investigate, Process Analysis |
| netconn_local_ipv6 | Investigate, Process Analysis |
| parent_cmdline | Investigate |
| parent_cmdline_length | Investigate |
| parent_publisher_state | Investigate |
CB LiveOps
Scheduled Queries: Added time and time zones

The User column on the Scheduled results page has been removed; that information is still available by clicking on the Query Details icon:
Schedule Summary added to SQL tabs

CB ThreatHunter
New event type available: Scriptload
scriptload_name
scriptload_hash
scriptload_publisher
scriptload_publisher_state
scriptload_md5
scriptload_sha256
scriptload_reputation
On the Process Analysis page,a new facet category called scriptload can filter the Events table to show only these scriptload events.
The following table provides a general timeline for when you can expect to see these changes in the Carbon Black Cloud console. Please reference the URL that appears in your browser when you sign into the Carbon Black Cloud console.
| Login URL | ETA |
| https://dashboard.confer.net/ | December 4 |
| https://defense.conferdeploy.net | December 4 |
| https://defense-prod05.conferdeploy.net | December 5 |
| https://defense-eu.conferdeploy.net | December 5 |
| https://defense-prodnrt.conferdeploy.net/ | December 5 |
Carbon Black Cloud
Event Forwarder
Unified architecture supports all Carbon Black Cloud products through a single Event Forwarder
Endpoint event forwarding for CB Defense and CB ThreatHunter events to a defined customer-provided Amazon S3 bucket
Data translation and transformation for converting the raw data sent by the endpoints into more consumable formats
Self-service capabilities to create, edit, un-enable, enable, and delete forwarder configurations via APIs
Multi-destination forwarding to allow events to be sent to one or more S3 buckets
Documentation will be available in the Developer Network space of the UEX and on the Developer Network website shortly following this release.
Specialized event cards
CB Defense
Improvements to dismissing grouped alerts
Number of alerts in an alert group now displays in the Device column.
When dismissing an alert group, the total number of alerts that are being dismissed is displayed.
Audit log contains the total number of alerts that are dismissed with the request.
Detection analytics improvements
Improved detection of attacks that leverage malicious applications to bypass user account controls and elevate privileges. This is part of our continued effort to expose attackers using Living off the Land techniques - that is, attackers that use native applications for malicious purposes.
We’ve reduced high-impact false positives related to Windows Explorer injecting into common Windows processes. This particular form of injection is in the top 3 most prevalent reasons for injection false positives. With fewer false positives occurring in the dashboard, customers can focus on important threats faster.
The following list of improvements provides additional details:
| Type | Name | Description |
| Enhanced detection | User Account Control Bypass | Enhanced detection of certain native Windows applications escalate privileges and bypass User Account Control. |
| False positive | Injection | Eliminated false positive alerts related to an uncompromised explorer.exe injecting into common Windows processes. |
CB LiveOps
Schedule a query
You can now schedule a query. To schedule a daily, weekly or monthly query, go to Live Query > New Query, click either the Recommended or SQL Query tab, and click the Schedule button. Alternatively, you can schedule queries via our APIs; for full API documentation, please visit the Developer Relations website. When scheduling a query, we highly recommend that you consider the impact the query might have on your endpoints.
The time that you select when scheduling is the time when the query is sent to the targeted devices if they are active and online. It is not the time that the device will run the query (i.e., the device local time). Any endpoints that are offline when the query is scheduled to run will respond to the most recent running recurrence of the query when they come back online, and the results will show up on the Query Results > Scheduled tab.
After you have scheduled a query, you can consult the latest results of that query on the Query Results > Scheduled tab. Going forward, ad-hoc queries will appear in the One-Time tab and all scheduled queries and their runs will appear in the Scheduled tab. To view the runs of a scheduled query, click the > next to the name of the scheduled query; to view the results of an individual run, click the Time link.
You can take the following actions on the query schedule:
Edit the query name, the email notification settings and the frequency.
Stop the schedule from running in the future. Any queries in progress will run to completion.
Delete the schedule. This action also deletes all runs of the scheduled query.
You can also stop and delete individual runs of a scheduled query.
“Run” recommendation location change
We have changed the content and location of the Run field within the Recommended Query cards. The recommended run frequency is not a schedule, nor an indication that the query has been automatically scheduled for you.
Email opt-in
We have changed the default behavior of the email notifications setting across Live Query. The default setting now requires you to opt-in if you want to be notified when a query reaches completion.
CB ThreatHunter
Search fields are added to CB Response-to-CB ThreatHunter query translate API
digsig_result_parent converts to parent_publisher_state
digsig_result_child converts to childproc_publisher_state
digsig_result_filemod converts to filemod_publisher_state
Search API v0 removed
The deprecated Search API v0 is removed from production. All customers should migrate to the Search API v1. See https://developer.carbonblack.com/reference/carbon-black-cloud/cb-threathunter/latest/process-searc....
Updated Watchlist Alert ID
To improve the Alerts page's ability to group and dismiss related Watchlist Alerts, the ID for each Watchlist Alert is now unique per watchlist hit.
CB Defense
Threat Report widget on Dashboard
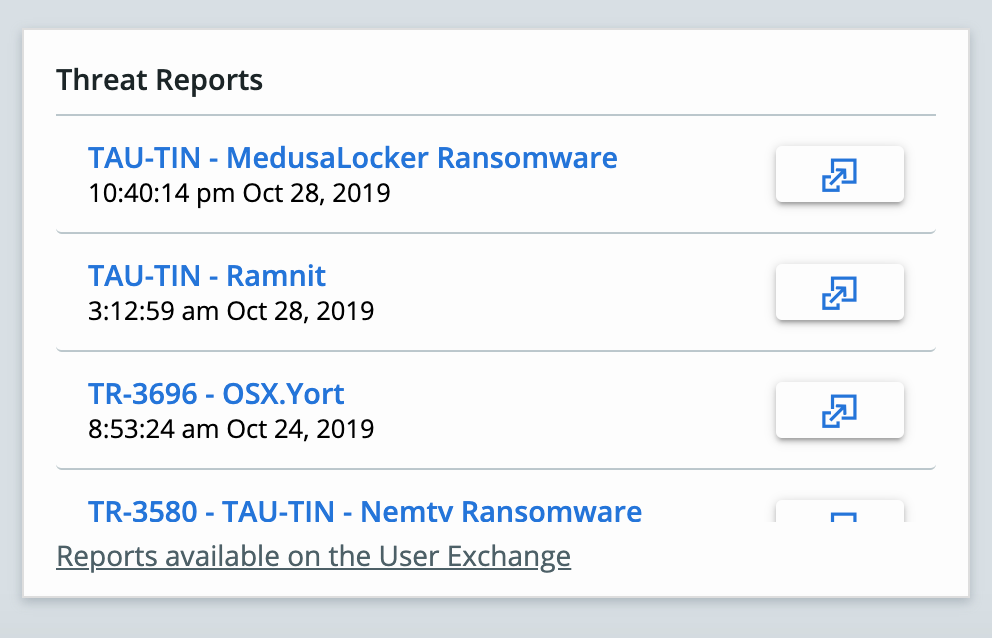
Click a threat report to get a summary of the latest threats, and investigate to see if the threat exists on your endpoints.
CB ThreatHunter
New Process ID (PID) information
Windows: Identifies the process that initiated a crossproc event. Crossproc events are provided for both the initiator and the target processes. Crossproc events for the target process report the initiator's PID in the event details pane.
Linux: When a process calls fork() to generate a new process instance, the Carbon Black Cloud reports the event from the original and the fork()ed process in one process. The Process Analysis page reports the PID of the fork() process in the event area, to help distinguish these events from events that are generated by the pre-fork() process.
Updated dynamic rules for Windows sensors
Reporting of discovered modloads
Enhanced cross-referencing between CB ThreatHunter and CB Defense data (if any)
Improved de-duplication of reported data
Architectural support for future sensor releases
The following table provides a general timeline for when you can expect to see these changes in the Carbon Black Cloud console. Please reference the URL that appears in your browser when you sign into the Carbon Black Cloud console.
| Login URL | ETA |
| https://dashboard.confer.net/ | October 23 |
| https://defense.conferdeploy.net | October 23 |
| https://defense-prod05.conferdeploy.net | October 24 |
| https://defense-eu.conferdeploy.net | October 24 |
| https://defense-prodnrt.conferdeploy.net/ | October 24 |
CB Defense
Detection analytics improvements
We’ve added improved detection of attacks that leverage native Windows applications to perform malicious activity (Living off the Land attacks), as well as other techniques such as accessibility debugger abuse, user account control bypass, and system log deletion.
We’ve also reduced high-impact false positives on macOS related to ransomware and reverse shell attacks, as well as ransomware behavior from Windows asset management applications.
The following list of improvements provide additional details:
|
Type |
Name |
Description |
|
Enhanced Detection |
Command Interpreter Downloads |
Enhanced detection of command interpreters reaching out to common sites used by attackers to host malware. |
|
Enhanced Detection |
Accessibility Debugger Abuse |
Enhanced detection of attackers modifying debugger executables, potentially allowing for command prompt access without logging in. |
|
Enhanced Detection |
User Account Control Bypass |
Enhanced detection of certain native Windows applications being leveraged to escalate privileges and bypass User Account Control. |
|
Enhanced Detection |
System Log Clearing |
Related to attackers leveraging the fsutil command to clear system logs and disk transactions to hide malicious activity. |
|
False Positive |
Ransomware |
Eliminated false positive alerts related to certain Windows asset management applications performing ransomware-like behavior. |
|
False Positive |
Ransomware (macOS) |
Eliminated false positive alerts related to common macOS developer tools performing ransomware-like behavior. |
|
False Positive |
Reverse Shell (macOS) |
Eliminated false positive alerts related to certain applications performing reverse shell-like behavior. |
CB LiveOps
Search on Recommended Queries
We’ve added a search bar on the Recommended tab of the New Query page to make it easier for you to find the right queries to run in your environment. You can search for any keyword found in the query name, description field, or SQL (including the SQL table itself). The search term will be highlighted in all relevant results to provide additional context.
Edit Recommended Queries SQL
Authored by Carbon Black cybersecurity experts, our Recommended Queries are now easier to modify and tailor to your environment with the addition of the Edit SQL button.
Click the + in the Recommended Query card of your choice, and then click Edit SQL. The SQL Query tab displays and you can edit the SQL as needed before running it in your environment. Any policy or endpoint selections made on the Recommended tab will display in the SQL Query tab for a seamless editing experience.
The following table provides a general timeline for when you can expect to see these changes in the Carbon Black Cloud console. Please reference the URL that appears in your browser when you sign into the Carbon Black Cloud console.
| Login URL | ETA |
| https://dashboard.confer.net/ | September 18 |
| https://defense.conferdeploy.net | September 18 |
| https://defense-prod05.conferdeploy.net | September 18 |
| https://defense-eu.conferdeploy.net | September 25 |
| https://defense-prodnrt.conferdeploy.net/ | September 25 |
Carbon Black Cloud
Enriched Events tab (CB Defense and CB ThreatHunter only)
If you use CB Defense and CB ThreatHunter together, the new Enriched Events tab on the Investigate page lets you search through all events that are enhanced with CB Analytics data. This page includes:
The ability to take action on these events.
The ability to view the reputation of all files that are associated with these events.
Clear indicators if an event is linked to an alert.
We have extended the capabilities of the Alert API by improving the methods of retrieving alerts and adding functionality to manage the workflow by updating the alert status. This lets you efficiently call an API by providing a wide range of filtered fields, and provides the ability to dismiss alerts.
CB Defense
Detection analytics improvements
We’ve added improved detection of attacks that leverage native Windows applications to perform malicious activity (Living off the Land attacks) as well as other techniques such as lateral movement across the environment, deletion of Windows registry keys, and system log deletion.
The following list of improvements provide additional details:
|
Type |
Name |
Description |
|
Enhanced Detection |
InstallUtil Malicious Network Connections |
Related to attackers leveraging Installutil (a Windows tool that is typically used to install server resources), to establish potentially malicious network connections to sites that are not typically used by Installutil. |
|
Enhanced Detection |
Mshta Powershell |
Related to Mshta (a Windows process that is typically used to execute HTML applications), invoking potentially malicious PowerShell scripts. |
|
Enhanced Detection |
Indirect Commands |
Related to Forfiles, Windows process executing commands without directly invoking the command line. |
|
Enhanced Detection |
System Log Clearing |
Related to attackers leveraging the Wevtutil command to clear system logs and disk transactions to hide malicious activity. |
|
Enhanced Detection |
Lateral Movement |
Related to attackers leveraging Windows Management Instrumentation (WMI), which provides status of local or remote systems, for lateral movement purposes by executing PowerShell on behalf of another machine. |
|
Enhanced Detection |
Windows Defender Modification |
Related to attackers leveraging PowerShell updating Windows Defender registry keys, opening up potential security holes in the system. |
|
Enhanced Detection |
Double File Extensions |
Related to attackers utilizing double file extensions (for example, memo.doc.js, report.xls.vbs) to deceive users and execute malicious scripts. |
|
Enhanced Detection |
Windows Registry Keys |
Related to attackers making suspicious entries to Windows registry keys (particularly Run/RunOnce), potentially resulting in malicious applications that execute upon login. |
|
Enhanced Detection |
macOS Gatekeeper Bypass |
Related to attackers launching suspicious binaries from the /net directory (traditionally reserved for NFS-mounted shares). |
|
False Positive |
System Injection |
Eliminated false positive alerts that were related to a Windows command line tool injecting into a system process. |
|
False Positive |
Injection |
Eliminated false positive alerts related to certain Windows cloud drive tools injecting into other system processes. |
CB LiveOps
Live Query console improvements
A series of console improvements makes Live Query easier to use and provides space for future additional functionality. We divided the original Live Query page into two separate pages under one link in the navigation bar:
To craft a new query, click Live Query and then click New Query. To review results of past or currently-running queries, click Query Results.
We redesigned the Recommended tab to make it easier for you to find pre-built queries. At the top of the new tab, five categories help you find and filter the best queries based on your use case. The default category is All, which lets you browse through all queries. Click a category filter to show only the queries that exist in that category.
We moved the Email feature to the top navigation pane. Your selection persists across sessions; if you uncheck a selection, it remains unchecked until you check it again.
We added an OS filter to help you find queries for a specific operating system. You can select multiple operating systems; the query list shows queries that match any of the selected operating systems.
Queries now run against all endpoints by default, which makes it easier to query against all endpoints that are running a selected operating system. You can still query on selected policies and endpoints. If you select a policy or endpoint type, the Run button is un-enabled for queries that are incompatible with your selection. For example, if you select a Linux endpoint, the Run button on Windows-only and macOS-only queries is un-enabled. The Run button is also un-enabled if you do not have any active endpoints of that operating system in your environment.
We redesigned pre-built queries. For each query, we added expected results and the frequency with which to run each query. Click the + button on a query card to display the SQL equivalent of that query.
When you click the Run button, a green notification confirms that the query has successfully started.
The Query History table is now on the Query Results page. You can view the status and results of currently-running or past queries.
Device view status and improvements
To provide extra context into what happens after you click Run, we improved the query-specific Results pages. We reordered the tabs so that the Devices tab now displays before the Results tab. You can get details on matches for a specific device by clicking the blue number under the Results column. All specific and granular data remains in the Results tab.
CB ThreatHunter
New URLs
We changed the prefix for the Investigate page URL. For example, in the PROD05 environment, the URL for the Investigate page is now https://defense-prod05.conferdeploy.net/cb/investigate.
We removed /threat-hunter/ from the Process Analysis page URL. For example, in the PROD06 environment, the URL for the Process Analysis page is now https://defense-eu.conferdeploy.net/analyze.
New search field
All searches for sensor_action:BLOCK can now be accomplished by searching for sensor_action:DENY. We made this change to ensure consistent terminology throughout the platform. The sensor_action value of DENY (and previously BLOCK) describes the action of the Carbon Black Cloud sensor preventing a process from starting.
Please update scripts and CB ThreatHunter Watchlists to use the new sensor_action:DENY value for any places where you previously searched for sensor_action:BLOCK.
CB LiveOps
Query History Table and Status Bar improvements
To make Live Query results easier to interpret, we consolidated the Query History Table. Based on user feedback, we removed the Matches and Last Result columns, rearranged the remaining columns, and added three new device-centric columns:
Responded: These devices have run the query and returned results back to the cloud by successfully matching the query (one or more results returned), not matching the query (zero results returned), or returning with an error.
In Progress: These devices have received the query and are in the process of running it and uploading results.
We removed the Timed out query status because it caused confusion. A query can now be completed if all devices have responded or if seven days have elapsed.
We changed the progress bar on the individual query results page. The progress bar shows the same information that is available on the Query History table, with the addition of a device count. It will dynamically update as devices respond.
CB ThreatHunter
Favorite search improvements
When a Favorite Search is selected on the Investigate page, it will replace the existing search bar contents rather than append the Favorite Search to existing text. This change was made based on customer feedback.
Improved search field: enriched
We renamed the legacy search field to enriched in Investigate and Process Analysis search interfaces to more accurately reflect the returned results.
When searching in Investigate for analytics-enriched results, search supports enriched:true as the best way to find those events and processes.
All future Watchlist IOCs should migrate to using enriched:true and remove legacy:true.
The search interface and all Watchlist IOCs support both enriched and legacy search fields for at least six months, after which time the support for legacy will be removed.
CB LiveOps
Improved In Progress visibility
We have added an In Progress status in the Devices tab to give more insight into a query. This status appears when a device has checked in with the cloud backend, which has received the query and is running the query and uploading results.
Additional recommended queries
Since our last release, we have more than doubled the number of recommended queries that are available in the Recommended tab. These queries are expertly crafted by our internal threat research team and CB LiveOps experts. For more queries, check out our public Query Exchange.
CB ThreatHunter
Save favorite searches
CB ThreatHunter now lets you save favorite searches. There are two new icons on the Investigate page: a star symbol and a down-arrow.
Type a search into the search bar.
Click the star icon. You can optionally rename the search.
Click Save.
After a favorite search is saved, any user can re-run that search. Click the down arrow to view searches. Click the favorite search to add that search to the search bar.
Users who have the Analyst 3, Admin, and Super Admin roles can perform the following actions based on the threathunter.events permission:
Rename favorite searches
Remove favorite searches
If you run the same search one or more times each day, consider using the Add search to threat report feature to create a custom automated Watchlist. This will run your search in the background 24 hours a day, potentially alerting you to any matches on that search.
You can use favorite searches as building blocks. If you frequently use the same set of search terms, you can create a Favorite that includes that sequence, and append it to situation-specific searches.
For example, you might frequently search for an activity that originates from a large number of web browsers. Perhaps one day you're searching for any time that browsers have connected to a potentially malicious domain, and another day you're searching for browser activity that loaded a potentially malicious module. You can type out the entire search each time; for example:
netconn_domain:hackerz.tech AND (process_name:chrome.exe OR process_name:firefox.exe OR process_name:microsoftedge*.exe)
modload_hash:6426cf806ecfc1432326bd4e0c9d0bba25b8db8ff5a79ef2722e7ddd889a8f30 AND (process_name:chrome.exe OR process_name:firefox.exe OR process_name:microsoftedge*.exe)
Or, you can create a Favorite with search process_name:chrome.exe OR process_name:firefox.exe OR process_name:microsoftedge*.exe and name it "Browsers".
The next time your search includes all browsers, you can type out the specifics of the unique search, open the list of Favorites, and select the "Browsers" favorite. CB ThreatHunter will append the Favorite's contents into the search bar and add it to your search query.
New search fields
We’ve introduced two new search fields:
enriched:true — Helps you find all CB Defense data that is enriched by the Carbon Black Cloud analytics engine.
process_cmdline_length — Lets you find processes that were launched by using a lengthy command line (for example, process_cmdline_length:[100 to *]).
Carbon Black Cloud
Relative time zones
When a date and time are displayed in the console, a tool tip now indicates the relative timezone.
For example, if the device time is reported as 4:41:37pm Aug 1, 2019, and you are located in the U.S. Pacific time zone (UTC -07:00), the device time data is reported as 4:41:37pm Aug 1, 2019.
When you hover your mouse over the device time cell, a tool tip shows the timezone into which the timestamp has been converted (for example, UTC -07:00).
Prevent users from changing their roles
Carbon Black now restricts user from changing their role to protect users from accidentally demoting themselves into a role with fewer permissions. Because users could never promote themselves into a role with more permissions, self-demotions required a more powerful user to reverse the change. These situations are now avoided.
CB ThreatHunter
New search fields
| Search field | Description | Examples |
|
process_cmdline_length |
Helps track down processes that have unusually long command lines. |
search for process_cmdline_length:[100 TO *] |
| enriched |
Helps surface the behavior-based event data that is provided by CB Defense. Note: This field was added to sensor data on July 17, 2019. It will take 30 days until all data is tagged with this new field. |
search for enriched:true to find all enriched data search for -enriched:true to find all non-enriched data |
Carbon Black, Inc. | 1100 Winter Street, Waltham, MA 02451 USA | Tel: 617.393.7400
Copyright © 2011–2019 Carbon Black, Inc. All rights reserved. Carbon Black, CB Defense, CB ThreatHunter, CB ThreatSight, and CB LiveOps are registered trademarks and/or trademarks of Carbon Black, Inc. in the United States and other countries. All other trademarks and product names may be the trademarks of their respective owners.
- Mark as Read
- Mark as New
- Bookmark
- Permalink
- Report Inappropriate Content
Carbon Black Console Release Notes Updated - May 20, 2020
- Mark as Read
- Mark as New
- Bookmark
- Permalink
- Report Inappropriate Content
Carbon Black Console Release Notes Updated - May 26, 2020
- Mark as Read
- Mark as New
- Bookmark
- Permalink
- Report Inappropriate Content
Carbon Black Cloud Console release notes updated June 11, 2020.
- Mark as Read
- Mark as New
- Bookmark
- Permalink
- Report Inappropriate Content
Carbon Black Cloud Console release notes updated June 22, 2020.
- Mark as Read
- Mark as New
- Bookmark
- Permalink
- Report Inappropriate Content
Carbon Black Cloud Console release notes updated November 9, 2020.
- Mark as Read
- Mark as New
- Bookmark
- Permalink
- Report Inappropriate Content
Carbon Black Cloud Console release notes updated November 11, 2020.
- Mark as Read
- Mark as New
- Bookmark
- Permalink
- Report Inappropriate Content
Carbon Black Cloud Console release notes updated November 23, 2020.
- Mark as Read
- Mark as New
- Bookmark
- Permalink
- Report Inappropriate Content
Carbon Black Cloud release notes are updated on November 30, 2020.
- Mark as Read
- Mark as New
- Bookmark
- Permalink
- Report Inappropriate Content
Carbon Black Cloud Console release notes updated December 7, 2020.
- Mark as Read
- Mark as New
- Bookmark
- Permalink
- Report Inappropriate Content
December 16, 2020 Console release notes are published.
- Mark as Read
- Mark as New
- Bookmark
- Permalink
- Report Inappropriate Content
December 22, 2020 Console release notes are published.
- Mark as Read
- Mark as New
- Bookmark
- Permalink
- Report Inappropriate Content
January 25, 2021 Console release notes are published.
- Mark as Read
- Mark as New
- Bookmark
- Permalink
- Report Inappropriate Content
February 8, 2021 Console release notes with a link to VMware Workloads Release Notes is published.
- Mark as Read
- Mark as New
- Bookmark
- Permalink
- Report Inappropriate Content
March 2, 2021 Console release notes are published.
- Mark as Read
- Mark as New
- Bookmark
- Permalink
- Report Inappropriate Content
March 18, 2021 Console release notes are published.
- Mark as Read
- Mark as New
- Bookmark
- Permalink
- Report Inappropriate Content
April 1, 2021 Console release notes are published.
- Mark as Read
- Mark as New
- Bookmark
- Permalink
- Report Inappropriate Content
April 26, 2021 Console release notes are published.
- Mark as Read
- Mark as New
- Bookmark
- Permalink
- Report Inappropriate Content
April 29, 2021 Console release notes are published.
- Mark as Read
- Mark as New
- Bookmark
- Permalink
- Report Inappropriate Content
May 3, 2021 Console Release Notes are published.
- Mark as Read
- Mark as New
- Bookmark
- Permalink
- Report Inappropriate Content
May 27, 2021 Console release notes are published.
- Mark as Read
- Mark as New
- Bookmark
- Permalink
- Report Inappropriate Content
June 8, 2021 Console release notes are published.
- Mark as Read
- Mark as New
- Bookmark
- Permalink
- Report Inappropriate Content
June 25, 2021 Console release notes are published.
- Mark as Read
- Mark as New
- Bookmark
- Permalink
- Report Inappropriate Content
July 16, 2021 Console release notes are published.
- Mark as Read
- Mark as New
- Bookmark
- Permalink
- Report Inappropriate Content
July 26, 2021 Console release notes are published.
- Mark as Read
- Mark as New
- Bookmark
- Permalink
- Report Inappropriate Content
August 5, 2021 Console release notes are published.
- Mark as Read
- Mark as New
- Bookmark
- Permalink
- Report Inappropriate Content
August 26, 2021 Console release notes are published.
- Mark as Read
- Mark as New
- Bookmark
- Permalink
- Report Inappropriate Content
September 17, 2021 Console release notes are published.
- Mark as Read
- Mark as New
- Bookmark
- Permalink
- Report Inappropriate Content
October 27, 2021 Console release notes are published.
- Mark as Read
- Mark as New
- Bookmark
- Permalink
- Report Inappropriate Content
November 1, 2021 Console release notes are published.
- Mark as Read
- Mark as New
- Bookmark
- Permalink
- Report Inappropriate Content
November 8, 2021 Console release notes are published.
- Mark as Read
- Mark as New
- Bookmark
- Permalink
- Report Inappropriate Content
November 18, 2021 Console release notes are published.
- Mark as Read
- Mark as New
- Bookmark
- Permalink
- Report Inappropriate Content
December 1, 2021 Console release notes are published.
- Mark as Read
- Mark as New
- Bookmark
- Permalink
- Report Inappropriate Content
December 6, 2021 Console release notes are published.
- Mark as Read
- Mark as New
- Bookmark
- Permalink
- Report Inappropriate Content
December 17, 2021 Console release notes are published.
- Mark as Read
- Mark as New
- Bookmark
- Permalink
- Report Inappropriate Content
January 13, 2022 Console release notes are published.
- Mark as Read
- Mark as New
- Bookmark
- Permalink
- Report Inappropriate Content
January 24, 2022 Console release notes are published.
Copyright © 2005-2023 Broadcom. All Rights Reserved. The term “Broadcom” refers to Broadcom Inc. and/or its subsidiaries.


